POCUS · Heart

Focused cardiac ultrasound.

Five views, five questions. Get the picture, then judge the pump.

Five views. Five questions. One bedside decision.

Focused cardiac ultrasound (FoCUS) is a goal-directed, qualitative scan. The clinician at the bedside does it to answer a small number of time-critical, mostly yes/no questions in a shocked or breathless patient. It is not a comprehensive echocardiogram, and a normal FoCUS does not rule out structural heart disease.

By the end you should be able to

  • Hold a phased-array probe in the cardiac convention and get PLAX, PSAX, A4C, subcostal 4-chamber and IVC views.
  • Recognise the most common faults in each view and correct them.
  • Grade LV systolic function in multiple views; distinguish EF, stroke volume and forward flow.
  • Recognise RV dilatation and dysfunction; assess clues to chronic disease.
  • Tell pericardial from pleural effusion and epicardial fat, and recognise tamponade physiology.
  • Use the IVC, LVOT VTI and passive leg raise sensibly, and know their limits.
  • Grade venous congestion with VExUS and integrate it with perfusion and the cause of shock.
  • Know when to stop and ask for a formal echo.
  • 01 · The FoCUS questions
  • Part I · Acquisition · five views
  • Part II · The left ventricle, with real clips
  • Part III · The right ventricle, with real clips
  • Part IV · Pericardium and shock patterns
  • Part V · Extension: IVC, VTI and VExUS
  • Part VI · Five shocked patients
  • Quick check · Close
Schematic · parasternal long axis
Schematic · apical four-chamber
Animated schematics. Real cine loops are in the LV, RV and effusion sections.
Start · The FoCUS questions

Ask a question you can answer. Then scan to answer it.

Establish the cardiac question, obtain interpretable views, then assess each ventricle and the pericardium.

  • 1
    AskWhat is the clinical question, and would the answer change what I do now? If not, don't scan. Treat.
  • 2
    AcquireAim for at least two windows that answer the question. In a supine, ventilated patient, subcostal plus a parasternal view is often the most practical pair.
  • 3
    AssessAnswer the five core questions, each with yes / no / can't tell.
  • 4
    ActFit the answer into the clinical picture, treat, and rescan after the intervention.
The five core FoCUS questions (WINFOCUS 2014; ASE/ACEP 2010)
#QuestionMain view(s)
1Is there a pericardial effusion, and is it causing tamponade?Subcostal, PLAX
2How is the LV squeezing (hyperdynamic / normal / reduced / severely reduced)?PLAX, PSAX, A4C
3Is the RV dilated or failing?A4C, PSAX, subcostal
4What is the IVC doing (small and collapsing, or plethoric and fixed)?Subcostal IVC
5Is there a gross red flag (valve, mass, clot, aortic root)?
Recognise and refer (WINFOCUS 2014; Spencer/ASE 2013). Not a core ASE/ACEP 2010 application.
Any
Rules
  • Answer each question from at least two views if you can. One view can mislead.
  • Can't tell is an honest answer. A poor-quality scan is not a negative scan. Record an inadequate view explicitly; do not label an unassessed chamber normal.
  • FoCUS is repeatable. Rescan after a fluid bolus, a vasopressor or intubation.
  • SCCM 2024 focused update: ultrasound is suggested to guide management in septic shock, acute dyspnoea or respiratory failure and cardiogenic shock, and for targeted volume management (Díaz-Gómez 2025).
  • Write down which views you got, how good they were, and your answers.
Part I · Acquisition

Get the picture.

Probe, convention, windows. Get all five views and fix a bad one without help.

Schematic chest. Three windows, five views: parasternal (PLAX, PSAX), apical (A4C), subcostal (SC4C, IVC). Probe markers drawn for the cardiac preset.
Acquisition · Probe and knobology

Phased array, cardiac preset, marker on the right.

Probe: phased array (sector), about 1–5 MHz. Its small footprint fits between ribs, and it can image to depth.

Orientation conventions
  • Cardiac preset: the screen marker is on the right of the screen (echocardiography convention).
  • Abdominal / radiology preset: the screen marker is on the left.
  • If you scan the heart with an abdominal preset, the image comes out mirrored left to right. Either switch to the cardiac preset, or rotate the probe 180° from the positions on this page. Don't do both.
  • On this page, all probe-marker directions assume the cardiac preset: PLAX to the right shoulder (about 10 o'clock); PSAX to the left shoulder (about 2 o'clock); A4C and subcostal 4C to the patient's left (3 o'clock); IVC to the head (12 o'clock).
Knobs that matter
  • Depth: start deep (about 16–20 cm) so you can see the descending aorta and any pleural fluid behind the heart. Then reduce depth until the heart fills about two-thirds of the sector.
  • Gain: blood in the cavities should be black. Too much gain fills the cavities with speckle and can mimic thrombus or smoke. Too little loses endocardial borders and the edges of an effusion.
  • Focus / sector width: narrow the sector to raise the frame rate when you are judging motion.
  • Cine loop: always review the last few beats. Freeze to measure, then scroll.
  • ECG lead: if the machine has one, attach it. Tamponade timing and diastolic measurements depend on it.
Hold and move

Pencil grip, with the heel of the hand resting on the chest to stop drift. Use small movements. The four movements: slide (move along the skin), rotate (turn about the probe's long axis), tilt (rock towards or away from the marker, in the imaging plane), fan (angle across the imaging plane).

Sim 1 · Marker and preset
Probe on the chest
Screen · schematic
Acquisition · Five windows

Three places on the chest, five views.

Parasternal window

Left sternal edge, 3rd–5th intercostal space; left lateral decubitus if possible.

  • PLAX: marker to the right shoulder.
  • PSAX: from PLAX, rotate 90° clockwise so the marker points to the left shoulder.
Apical window

Point of maximal impulse, usually 5th intercostal space at about the anterior axillary line; further lateral in a big heart or in left lateral decubitus.

  • A4C: marker to the patient's left, beam aimed at the right shoulder.
Subcostal window

Just below the xiphoid; supine; knees flexed relaxes the abdomen.

  • Subcostal 4-chamber: probe almost flat on the abdomen, marker to the patient's left, aimed at the left shoulder, looking through the liver.
  • IVC long axis: from the subcostal 4C, centre the RA, then rotate anticlockwise until the marker points to the head (12 o'clock). Follow the IVC into the RA.
When the window is poor
  • Ventilated, COPD or obese patients: parasternal and apical windows are often poor. The subcostal window is often the best and is reachable without moving the patient.
  • Post-laparotomy, distended or painful abdomen: subcostal is limited, so go parasternal.
  • Breath-hold at end-expiration, or a brief end-expiratory pause on the ventilator, if safe.
Sim 2 · View finder
Probe position · tap a window
Screen · schematic
View quality 0%
    Acquisition · Parasternal long axis

    PLAX: the LV lies flat, and the aorta tells you where you are.

    What you should see, near field to far field

    Chest wall → RV / RVOT → interventricular septum → LV cavity → posterior LV wall → pericardium (bright line) → descending thoracic aorta in cross-section, behind the LA. On screen-right: the aortic root with the aortic valve, and the LA beneath it. The anterior mitral leaflet is continuous with the posterior aortic root.

    What it answers
    • LV systolic function: eyeball, EPSS, fractional shortening.
    • Pericardial versus pleural effusion. The descending aorta is the landmark.
    • Gross aortic and mitral valve red flags.
    • RVOT size: compare the RVOT with the aortic root. In normal hearts they are similar.
    ErrorFix
    LV slopes steeply (not horizontal)Move one rib space up or down until the LV lies flat
    Aortic valve not seen, only LV and mitral valveRotate slightly towards the right shoulder; slide closer to the sternum
    Heart small, deep in the sectorReduce depth after you have checked behind the heart
    Lung artefact hides the heartLeft lateral decubitus; move closer to the sternum; scan in expiration
    Measuring on an oblique cutMake sure the LV is horizontal and both valves are in plane before any M-mode
    Do not measure EPSS or fractional shortening on an off-axis PLAX. An oblique cut overestimates cavity size.
    Schematic, not a real scan. Labels show the standard PLAX structures.
    Acquisition · Parasternal short axis

    PSAX: a round LV at papillary level, or it isn't short axis.

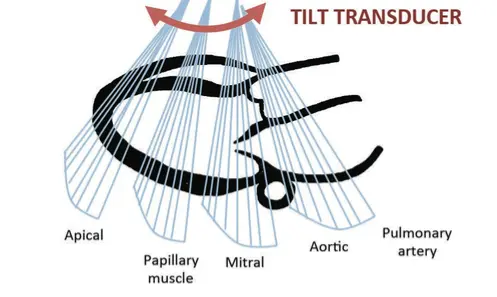
    How to get it: from a good PLAX, keep the LV in the centre and rotate 90° clockwise (marker to the left shoulder). Tilt the beam towards the apex (towards the patient's left hip), i.e. move the probe tail towards the right shoulder, until both papillary muscles appear.

    Levels, base to apex (tilt to move between them)

    Aortic valve level (the 'Mercedes sign', with RVOT and pulmonary valve) → mitral valve level (the 'fish mouth') → mid-papillary level, the FoCUS standard → apical level.

    What it answers
    • Global LV function: concentric inward motion and thickening. The best single view for 'how is it squeezing'.
    • Regional wall motion at mid-papillary level: LAD anterior and anteroseptal; RCA inferior and inferoseptal; LCx inferolateral and anterolateral. Territories overlap; this is approximate.
    • The septum: a round 'O' LV is normal. A D-shaped LV means RV overload: systolic flattening suggests pressure overload (it may persist into diastole); isolated diastolic flattening suggests volume overload.
    • Hyperdynamic, empty LV: papillary muscles touch at end-systole ('kissing papillary muscles').
    ErrorFix
    LV oval or egg-shapedOff-axis: rotate a few degrees either way until round
    Fish mouth (mitral valve) instead of papillary musclesTilt to aim further towards the apex
    Pseudo-D-shapeAn oblique cut flattens the septum: correct the rotation before calling a D-sign
    Real scan · Papillary-level PSAX

    Real papillary-level PSAX cine: follow circumferential wall thickening and inward motion. Interpret alongside other levels and views; this loop is not a quantitative EF measurement.

    Source and licence

    I.A.C. van der Bilt, MD, Department of Echocardiography AMC; CardioNetworks/ECHOpedia (Vdbilt). Original clip → · CC BY-SA 3.0. Adaptation: examination-date header masked, H.264 transcode and poster extracted. Original creator credit retained.

    Acquisition · Apical four-chamber

    A4C: the apex goes at the top, sharp, not round.

    How to get it: left lateral decubitus with the left arm up if possible. Find the apex beat. Place the probe there, marker to the patient's left (3 o'clock), and aim towards the right shoulder. Slide until the apex is at the top-centre of the screen and the septum is vertical.

    What you should see

    LV on screen-right, RV on screen-left, atria below. Mitral and tricuspid valves are visible. The tricuspid annulus sits slightly closer to the apex than the mitral annulus.

    What it answers
    • RV:LV size comparison: the key view for RV size.
    • TAPSE: M-mode through the lateral tricuspid annulus.
    • Global and regional LV function (septal and lateral walls).
    • Pericardial effusion: lateral to the LV, and around the RA.
    • Gross valve red flags.
    • LVOT VTI: tilt anteriorly to get the apical 5-chamber view.
    ErrorLooks likeFix
    Foreshortening, the commonest errorApex rounded and thick-walled, LV short and globular, apex appears to move vigorouslySlide laterally and/or down one rib space to the true apex; LV should be about 1.5–2× longer than wide
    5-chamber (LVOT and aortic valve appear)Extra outflow 'chamber' in the middleTilt the beam posteriorly
    Septum tiltedChambers leanSlide the probe until the apex is centred, then rotate slightly
    RV wall cut offRV looks smallMove slightly medially or rotate; a cut-off RV makes RV:LV comparison invalid
    Pitfall: a foreshortened A4C underestimates LV volumes, can overestimate EF or miss apical pathology, and makes the RV:LV ratio unreliable.
    Real scan · Apical four-chamber

    Real A4C cine: identify all four chambers, the septum and AV valves across the cycle. A single normal example does not exclude cardiac disease or establish an EF.

    Source and licence

    I.A.C. van der Bilt, MD, Department of Echocardiography AMC; CardioNetworks/ECHOpedia (Vdbilt). Original clip → · CC BY-SA 3.0. Adaptation: examination-date header masked, H.264 transcode and poster extracted. Original creator credit retained.

    Acquisition · Subcostal and IVC

    Subcostal: the window that works when the others don't.

    Subcostal 4-chamber
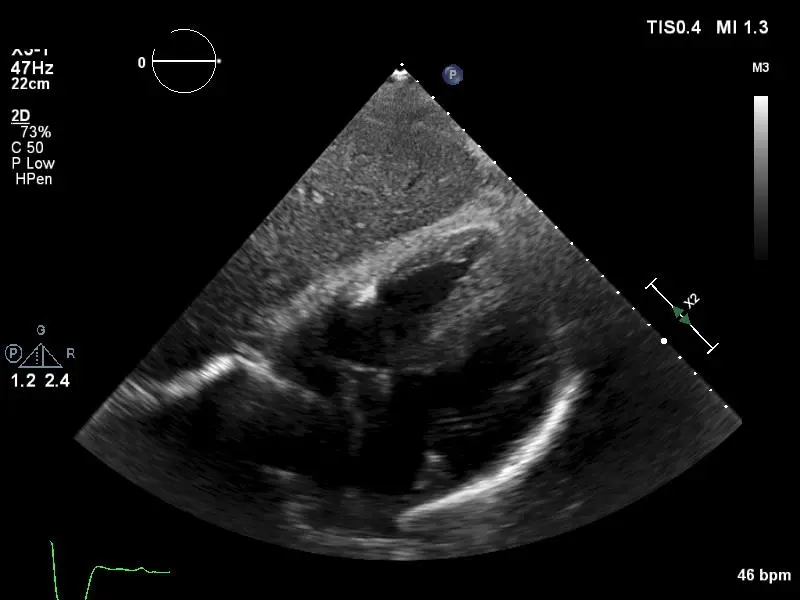
    • Supine, knees flexed. Probe just below the xiphoid, almost flat (10–30° to the skin), marker to the patient's left. Aim at the left shoulder through the liver.
    • On screen: liver at the top, then RV free wall, RV, septum, LV. In the cardiac preset the atria lie on the left of the screen and the apex points to the right.
    • Press firmly and wait for the patient to exhale. Don't fight the liver: use it as the window.
    • Best view for: pericardial effusion (between the liver and the RV free wall), RV free-wall diastolic collapse, cardiac arrest pulse checks, ventilated or COPD patients.
    IVC long axis
    • From subcostal 4C, centre the RA. Rotate anticlockwise until the marker points to the head (12 o'clock). Fan slightly to the patient's right.
    • Confirm it is the IVC: it enters the RA; a hepatic vein drains into it; it has a thin wall; its size changes with respiration.
    • The aorta lies more to the left and deeper. It has thick walls, does not enter the RA, and pulsates with arterial timing.
    • Measure perpendicular to the IVC long axis, about 1–2 cm from the cavo-atrial junction, just caudal to where the hepatic vein joins, at end-expiration. M-mode can help but beware of translational movement.
    ErrorFix
    Only liver seen, heart deep or absentFlatten the probe, push deeper, increase depth, bend knees
    Narrow IVC that 'collapses' oddlyCylinder effect: the beam is cutting the IVC off-centre. Fan side to side until it is at its widest; check in short axis
    Measuring the aortaConfirm drainage into the RA and a hepatic vein joining
    Measuring at the RA junctionMove about 2 cm caudally; the junction narrows with RA contraction
    Acquisition · Troubleshooting

    Name the fault. Fix it in one move.

    Most bad images come from a small number of faults. Learn to name each one and make a single correction rather than wandering.

    PLAXLV sloping → change rib space. No aortic valve → rotate towards the right shoulder.
    PSAXOval → rotate. Fish mouth → tilt to the apex.
    A4CForeshortened → slide laterally / down a space. 5-chamber → tilt posteriorly.
    SubcostalNo heart → flatten, deepen, bend knees.
    IVCNarrow → fan to the widest diameter; confirm it enters the RA.
    EverywherePosition the patient first (left lateral decubitus for parasternal and apical windows). Start deep, then come up. Breathe out.
    Sim 3 · Fix the view ·

    Pick the single movement that fixes this view.
    Score 0 / 8
    Part II · The left ventricle

    Judge the pump.

    Is the LV squeezing, and is that contributing to this patient's instability? Eyeball first, with a system. Then back it up with a number you trust.

    Normal values and EF grades follow the ASE/EACVI 2015 chamber-quantification recommendations.

    Three questions, three measurements

    1 Walls

    1. Do the walls thicken and the cavity shrink?
    2. FS, FAC, Simpson's

    2 Annulus

    1. Does the mitral annulus move briskly towards the apex?
    2. MAPSE

    3 Leaflet

    1. In PLAX, does the anterior leaflet nearly touch the septum?
    2. EPSS

    Then grade it: four grades · clip questions · EF is not output

    Schematic PSAX at mid-papillary level: a round LV with symmetric inward motion and thickening.
    LV · Systolic function

    Eyeball first. Then back it up.

    Systolic function is the LV's ability to get smaller from diastole to systole. Judge it globally (the whole chamber) and regionally (does each wall thicken?). Grade in at least two views.

    GradeWhat you see
    HyperdynamicSmall cavity, near-obliterated at end-systole, kissing papillary muscles
    NormalBrisk symmetric inward motion and thickening; anterior mitral leaflet nearly touches the septum
    Mildly to moderately reducedVisibly less inward motion; mitral leaflet stays well away from the septum (the sim calls this "Reduced")
    Severely reducedVery little thickening and cavity reduction; the LV may be dilated, but dilatation is not required

    These are semiquantitative bedside grades used by intensivists (Melamed 2009). An experienced eye grades well, but learners agree only moderately with formal measurement.

    Measured LVEF (2D biplane) · ASE/EACVI 2015
    CategoryMenWomen
    Normal52–72%54–74%
    Mildly abnormal41–51%41–53%
    Moderately abnormal30–40%
    Severely abnormal<30%

    These are method-specific reference ranges for a measured EF, not eyeball precision. The bands come from the 2015 chamber-quantification update (Lang 2015).

    Back up the eyeball
    • Linear: fractional shortening, MAPSE, EPSS. Quick, but one line stands for the whole LV. Linear measurements →
    • Area and volume: FAC in short axis, Simpson's biplane in A4C and A2C. Better geometry, but needs clear borders and time. FAC and Simpson's →
    Wall thickening
    • Judge thickening, not just inward motion. A scarred, akinetic segment can be pulled inwards by its neighbours (tethering), but it won't thicken.
    • Regional thinning (<6 mm) with akinesis suggests old infarction.
    • A new regional abnormality with shock raises concern for ischaemia or a mechanical complication. Obtain ECG, clinical context and urgent expert echo; stress cardiomyopathy, myocarditis and conduction changes are alternatives.
    The intensivist's question: is this reduction contributing to my patient's haemodynamic instability? A patient whose EF is 35% at home may look 40–45% today because hypovolaemia or vasodilatation has lowered the load. A vasodilated, septic LV can look hyperdynamic despite intrinsic dysfunction. Compare with an old echo, and re-look once vasopressors restore afterload.
    Sim 4 · LV function
    PSAX · mid-papillary
    PLAX · tap to move cursor
    M-mode · cursor at the mitral leaflet tips

    Real clips: four grades, apical four-chamber

    Watch each loop twice: once for the cavity, once for wall thickening. The burned-in "FE" is the Spanish/French abbreviation for ejection fraction; the numbers are the source's estimates, not measurements you can check from the loop.

    Hyperdynamic, A4C. Small cavity that almost disappears at end-systole. Burned-in label FE 70%, but the source slide says 78%, so read it as hyperdynamic rather than as a number. Clip: SCCM Critical Care Ultrasound: Adult, used with permission
    Normal, A4C. Brisk, symmetric thickening of every wall; the mitral annulus moves well towards the apex. Burned-in label FE 60%. Clip: SCCM Critical Care Ultrasound: Adult, used with permission
    Moderately reduced, A4C. Visibly less thickening and cavity change. Burned-in label FE 35%. Clip: SCCM Critical Care Ultrasound: Adult, used with permission
    Severely reduced, A4C. A big LV that barely changes size; the walls hardly thicken. Burned-in label FE 10%. Clip: SCCM Critical Care Ultrasound: Adult, used with permission

    EF categories: Lang 2015.

    LV · Linear measurements

    One line through the heart: quick, but only as good as the geometry.

    Fractional shortening (FS) · PLAX M-mode just beyond the leaflet tips
    FS = (LVIDd − LVIDs) / LVIDd × 100
    • Put the cursor perpendicular to the LV long axis. An oblique line cuts the cavity on the slant and overestimates both diameters.
    • Measure LVIDd at end-diastole (QRS) and LVIDs at the smallest cavity.
    • An FS of ≥30% is normal and <20% is severely impaired (older teaching values). FS is one dimension: it ignores the apex and misleads with a regional wall motion abnormality.
    • Normal LVIDd is about 42–58 mm in men and 38–52 mm in women (ASE 2015). Above this means LV dilatation.
    • FS can also be measured in PSAX at the papillary level, where you can check that the cursor crosses the centre of a round LV.
    EF from a diameter (Teichholz)

    Many machines turn the two diameters into an "EF (Teich)" using LV volume = 7d³ / (2.4 + d). That assumes a symmetric, spheroidal LV with no regional abnormality and a centred, perpendicular cut. ASE/EACVI 2015 no longer recommends calculating LVEF from linear dimensions. Treat a machine EF from M-mode as a rough number at best.

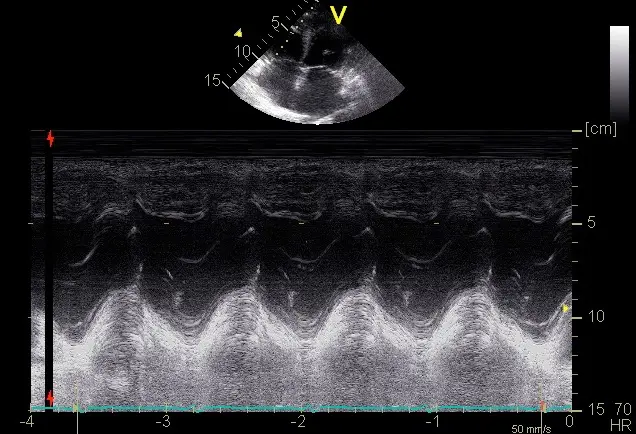
    Mitral annular plane systolic excursion (MAPSE) · A4C M-mode, lateral mitral annulus
    • In systole the longitudinal fibres pull the mitral annulus towards the apex. Less excursion means worse longitudinal function, and MAPSE correlates with LV function.
    • Line the cursor up with the annulus' motion and measure from the lowest to the highest point of the trace in one beat.
    • In a normal heart the tricuspid annulus travels farther than the mitral annulus. Compare with TAPSE.
    • Sex-specific MAPSE thresholds could not be verified, so use MAPSE qualitatively: brisk, reduced or barely moving.
    E-point septal separation (EPSS) · PLAX M-mode through the anterior leaflet tip
    • The anterior leaflet should nearly touch the septum in early diastole. EPSS is the shortest distance between the leaflet's early-diastolic E-point and the septum. Normal is under about 7 mm.
    • EPSS >7 mm was associated with severe LV dysfunction (EF <30%) in a small ED study (McKaigney 2014). It is a screening clue, not an EF measurement or a rule-out test.
    • Valve disease, septal hypertrophy and an off-axis cut make EPSS unreliable. A regional abnormality that spares the base may be missed. Check wall thickening and the apex in other views.
    Normal Normal LV, PLAX. Place the FS cursor just beyond the mitral leaflet tips, perpendicular to the long axis. Clip: SCCM Critical Care Ultrasound: Adult, used with permission
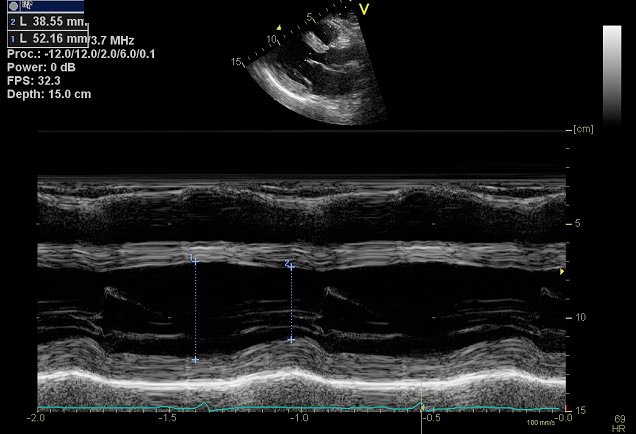
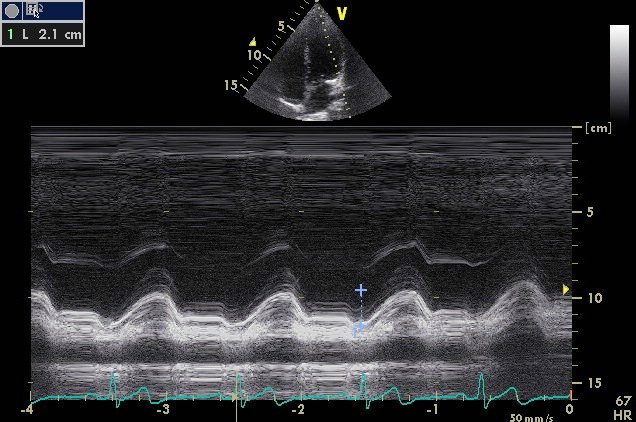
    PLAX M-mode with two vertical calipers measuring the LV internal diameter in diastole and systole.
    FS by M-mode. Two perpendicular calipers: end-diastole and end-systole. Image: SCCM Critical Care Ultrasound: Adult, used with permission
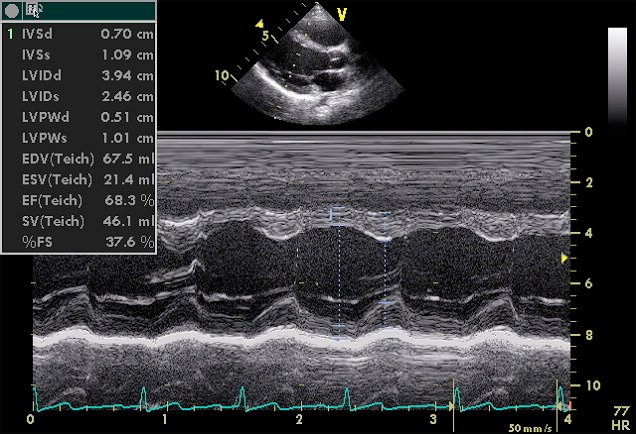
    PLAX M-mode with a machine calculation panel: LVIDd 3.94 cm, LVIDs 2.46 cm, FS 37.6 percent, EF Teichholz 68.3 percent.
    The machine does the arithmetic. LVIDd 3.94 cm, LVIDs 2.46 cm, so FS = 37.6%. The "EF (Teich)" of 68.3% is a geometric extrapolation from one line. Image: SCCM Critical Care Ultrasound: Adult, used with permission
    Normal Normal LV, PSAX mid-papillary. A round LV that thickens symmetrically. FS works here too, and this is the plane for FAC. Clip: SCCM Critical Care Ultrasound: Adult, used with permission
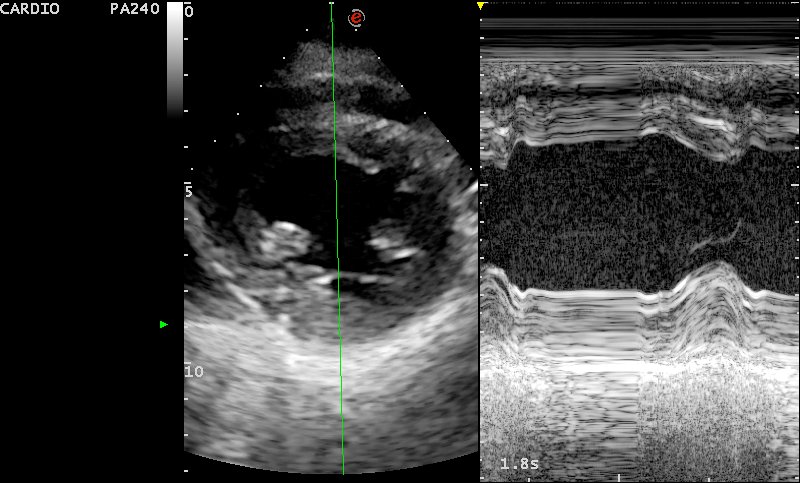
    Parasternal short-axis image with an M-mode cursor through the centre of the LV and the resulting M-mode trace.
    FS in short axis. Cursor through the centre of a round LV, between the papillary muscles. Image: SCCM Critical Care Ultrasound: Adult, used with permission

    MAPSE: watch the annulus

    Normal Normal A4C. Follow the lateral mitral annulus: it moves towards the apex in systole. Clip: SCCM Critical Care Ultrasound: Adult, used with permission
    Normal Normal A4C, both annuli. The tricuspid annulus (left of screen) travels farther than the mitral annulus in a normal heart. Clip: SCCM Critical Care Ultrasound: Adult, used with permission
    A4C, annular excursion. Where would you put the M-mode cursor? Through the lateral mitral annulus, parallel to its motion. Clip: SCCM Critical Care Ultrasound: Adult, used with permission
    Apical M-mode through the lateral mitral annulus showing the annular trace moving with each beat and a caliper measurement.
    MAPSE by M-mode. Measure from the lowest to the highest point of the annular trace in one beat. Shown for caliper technique; its reading is not used as a reference value. Image: SCCM Critical Care Ultrasound: Adult, used with permission
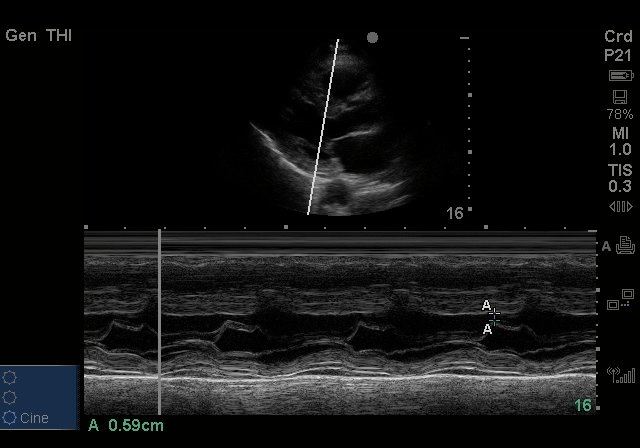
    PLAX M-mode through the anterior mitral leaflet showing the E-point and its distance from the septum, with a caliper reading 0.59 centimetres.
    EPSS by M-mode. Calipers from the septum to the E-point; this example reads 0.59 cm (5.9 mm). Shown for technique. Image: SCCM Critical Care Ultrasound: Adult, used with permission
    Linear methods: what they buy and cost
    GoodWatch out
    Easy and quick; one M-mode traceExtrapolates the whole LV from one line
    Repeatable in the same planeArrhythmia, off-axis cuts and regional wall motion abnormalities make it wrong

    Reliable only when the LV has normal geometry and symmetric function. Teichholz: Lang 2015. EPSS: McKaigney 2014.

    LV · Area and volume

    Trace the cavity: area in short axis, volume in two apical planes.

    Fractional area change (FAC) · PSAX, papillary level

    FAC = (EDA − ESA) / EDA × 100

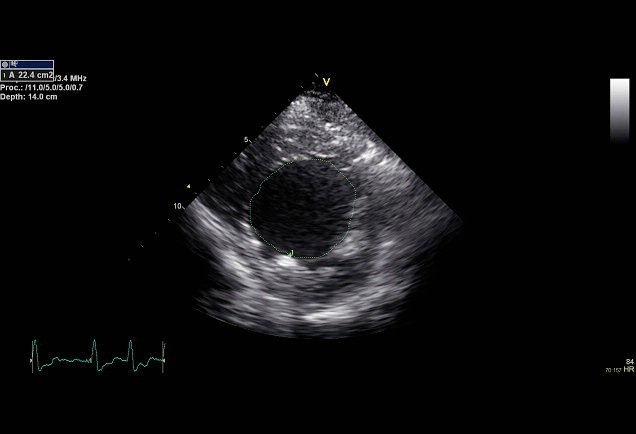
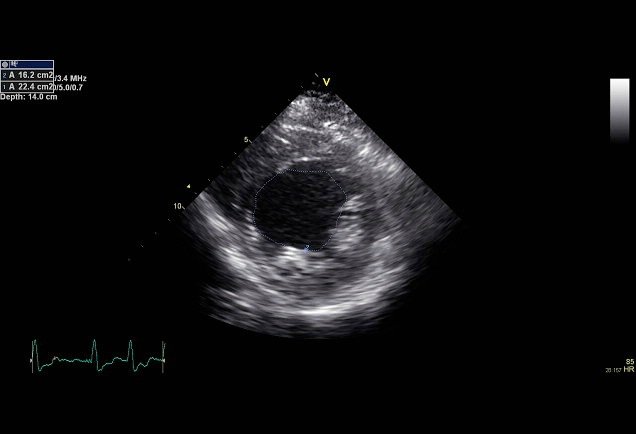
    Trace the endocardium at end-diastole and end-systole in the same, round short-axis cut. In the stills shown: (22.4 − 16.2) / 22.4 × 100 = 28%.

    • Relatively easy and quick.
    • One short-axis slice stands for the whole LV; apical abnormalities are missed.
    • Needs clear endocardial borders all the way round.

    No normal LV FAC cut-off is quoted because none could be verified. Do not borrow the RV FAC reference (>35%): different chamber, different plane.

    Parasternal short-axis still with the LV endocardium traced at end-diastole; area 22.4 square centimetres.
    End-diastole. Area 22.4 cm². Image: SCCM Critical Care Ultrasound: Adult, used with permission
    Parasternal short-axis still with the LV endocardium traced at end-systole; area 16.2 square centimetres.
    End-systole. Area 16.2 cm². FAC = 28%. Image: SCCM Critical Care Ultrasound: Adult, used with permission

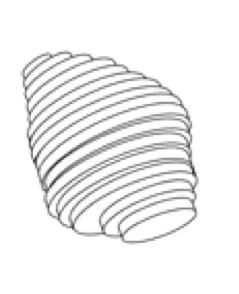
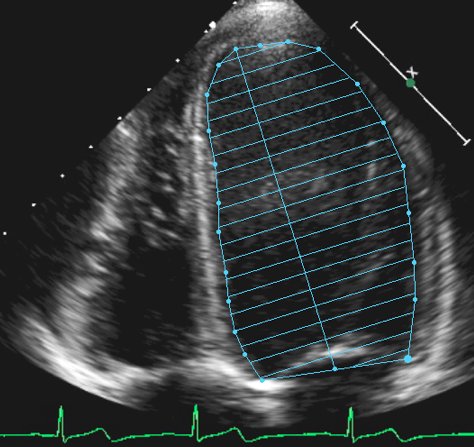
    Simpson's biplane (method of discs)

    Trace the endocardium in A4C and A2C at end-diastole and end-systole. The machine slices the LV into stacked discs from base to apex and adds up their volumes.

    EF = (EDV − ESV) / EDV × 100
    • Biplane discs is the 2D method recommended for measuring EF (ASE/EACVI 2015).
    • A foreshortened apex shortens the LV and underestimates volumes. Find the true apex first.
    • Volume-based and widely accepted, but it needs clear endocardial borders and takes time.
    Same patient, two planes

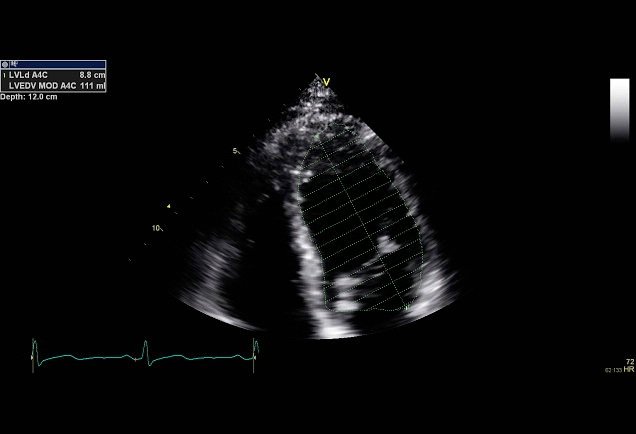
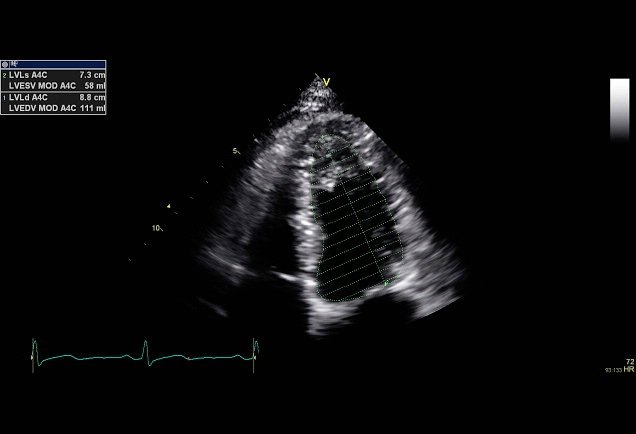
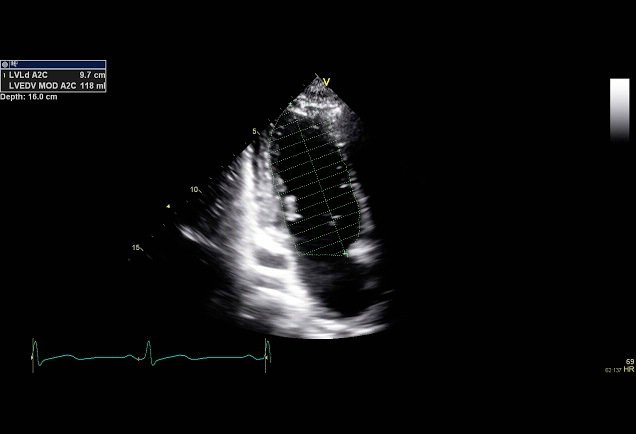
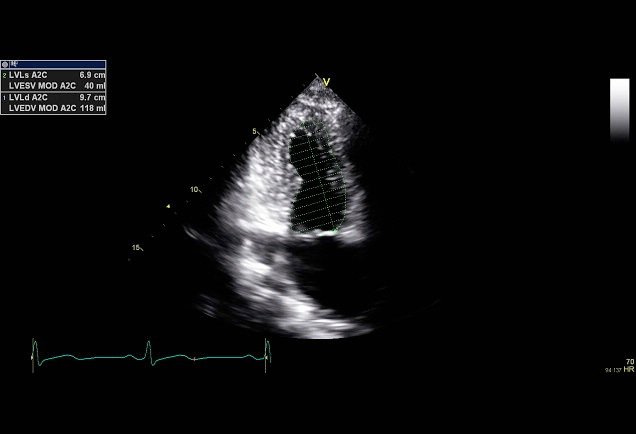
    The stills read A4C EDV 111 mL and ESV 58 mL (single-plane EF about 48%), and A2C EDV 118 mL and ESV 40 mL (about 66%). One plane can mislead, which is why the method uses both. The biplane result is not shown, so none is given here.

    Line drawing of an LV divided into a stack of thin discs from base to apex.
    Method of discs. The LV volume is the sum of many thin discs. Image: SCCM Critical Care Ultrasound: Adult, used with permission
    Apical four-chamber still with the LV endocardium traced and divided into horizontal discs along the long axis.
    A4C tracing. Endocardial trace with the discs drawn perpendicular to the long axis. Image: SCCM Critical Care Ultrasound: Adult, used with permission
    Apical four-chamber still with an end-diastolic trace; panel reads LVEDV MOD A4C 111 millilitres.
    A4C, end-diastole. EDV 111 mL. Image: SCCM Critical Care Ultrasound: Adult, used with permission
    Apical four-chamber still with an end-systolic trace; panel reads LVESV MOD A4C 58 millilitres.
    A4C, end-systole. ESV 58 mL. Image: SCCM Critical Care Ultrasound: Adult, used with permission
    Apical two-chamber still with an end-diastolic trace; panel reads LVEDV MOD A2C 118 millilitres.
    A2C, end-diastole. EDV 118 mL. Image: SCCM Critical Care Ultrasound: Adult, used with permission
    Apical two-chamber still with an end-systolic trace; panel reads LVESV MOD A2C 40 millilitres.
    A2C, end-systole. ESV 40 mL. Image: SCCM Critical Care Ultrasound: Adult, used with permission

    When you can't see the border, you can't trace it

    Poor endocardial definition, A4C. The lateral and apical borders drop out. A traced volume here would be a guess. Clip: SCCM Critical Care Ultrasound: Adult, used with permission
    Poor endocardial definition, A2C. Same problem in the second plane. Improve the window, consider contrast (an expert echo decision), or give a qualitative grade and say the views were limited. Clip: SCCM Critical Care Ultrasound: Adult, used with permission

    Method and EF categories: Lang 2015.

    LV · Clip questions

    Grade it yourself.

    Two worked examples, one clip question and two measurement checks. Watch every view, commit to a grade, then read why. Clips loop; use the controls to slow down or pause.

    Four views in one loop. Top: parasternal long and short axis. Bottom: two apical views. Clip: SCCM Critical Care Ultrasound: Adult, used with permission

    Question 1 · Worked example 1

    Parasternal and apical views from one patient. How would you grade LV function?

    Commit to an answer to see the explanation.

    PLAX. Walls and anterior leaflet. Clip: SCCM Critical Care Ultrasound: Adult, used with permission
    PSAX. Symmetric thickening? Clip: SCCM Critical Care Ultrasound: Adult, used with permission
    Apical. Cavity change and annulus. Clip: SCCM Critical Care Ultrasound: Adult, used with permission
    Subcostal four-chamber. Often the only view in a ventilated patient. Clip: SCCM Critical Care Ultrasound: Adult, used with permission

    Question 2 · Worked example 2

    Four views from another patient. How would you grade LV function?

    Commit to an answer to see the explanation.

    Question PLAX. Leaflet to septum, wall thickening. Clip: SCCM Critical Care Ultrasound: Adult, used with permission
    Question A4C. Cavity change and annular motion. Clip: SCCM Critical Care Ultrasound: Adult, used with permission
    Question PSAX. Thickening all the way round. Clip: SCCM Critical Care Ultrasound: Adult, used with permission

    Question 3 · Clip question

    Visual estimation of LV function for this patient is best described as:

    Commit to an answer to see the explanation.

    Apical four-chamber still with an end-systolic trace; panel reads LVESV MOD A4C 58 millilitres.
    A4C, end-systole. ESV 58 mL; end-diastole read 111 mL. Image: SCCM Critical Care Ultrasound: Adult, used with permission

    Question 4 · Measurement check

    The A4C Simpson stills read EDV 111 mL and ESV 58 mL. What is the single-plane EF?

    Commit to an answer to see the explanation.

    PLAX M-mode with a machine calculation panel: LVIDd 3.94 cm, LVIDs 2.46 cm, FS 37.6 percent, EF Teichholz 68.3 percent.
    EF (Teich). A volume extrapolated from one basal line. Image: SCCM Critical Care Ultrasound: Adult, used with permission

    Question 5 · Measurement check

    A patient has an anterior wall infarct with an akinetic apex. Which number would you trust least?

    Commit to an answer to see the explanation.

    LVOT diameter and VTI are taught in Flow and fluids.

    LV · Fraction, volume and flow

    A vigorous squeeze can still deliver little blood.

    Separate the fraction emptied, the volume ejected, and the flow reaching the circulation.

    EF depends on the starting volume.

    EF = (EDV − ESV) / EDV × 100
    Total LV stroke volume = EDV − ESV

    A 40 mL ventricle with EF 70% ejects 28 mL. A 200 mL ventricle with EF 30% ejects 60 mL. The lower EF does not necessarily mean the lower stroke volume. These are constructed examples, not normal reference volumes.

    Ejected volume may not all travel forward.

    With isolated mitral regurgitation (MR), total LV stroke volume includes blood returning to the LA. Forward stroke volume is the remainder. This model assumes no aortic regurgitation or shunt; it does not grade MR severity.

    Forward SV = total SV − mitral regurgitant volume
    Forward cardiac output = forward SV × HR / 1000

    At the bedside

    • Use good, non-foreshortened views. Formal EF usually uses biplane Simpson volumes or an appropriate 3D method.
    • Preload, afterload and valve disease affect EF. A hyperdynamic appearance does not establish adequate perfusion.
    • Measure forward flow when it changes the decision; interpret it with pressure, perfusion, valve findings and clinical context.
    Check your interpretation

    At the same EF, halving EDV halves total stroke volume. With the same total stroke volume, adding MR lowers forward output. Heart rate changes output per minute without changing stroke volume per beat in this fixed-input model.

    LVOT Doppler (LVOT diameter in mid-systole, VTI as stroke distance, CO = SV × HR) is taught in Flow and fluids. Continue to LVOT VTI and haemodynamic decisions →

    Explore · Ejection and forward flow

    Conceptual chamber model, not an ultrasound image. Dashed outline: end-diastolic cavity. Arrow width represents the split of ejected volume; it is not a Doppler jet.

    Part III · The right ventricle

    Is the RV big? Is it working?

    Ask the two questions in order: first size and shape, then how well it contracts. A dilated, failing RV changes what you do next. A fluid bolus, induction or positive-pressure ventilation can tip it over.

    Normal values follow the 2025 ASE right-heart guideline.

    RV · Anatomy and physiology

    The RV wraps around the LV.

    In short axis the RV is a crescent wrapped around the round LV. In an apical view it is a triangle. When it dilates it becomes rounder and can take over the apex, which the LV normally forms.

    It has two parts: an inflow (sinus) and an outflow (conus, or infundibulum). It contracts like a bellows, in a wave that runs from the inflow towards the outflow tract. The free wall runs from the apex to the outflow tract. Longitudinal shortening, inward free-wall movement and septal motion all help it eject.

    Built for a low-pressure circuit
    • Pulmonary pressures are about one-sixth of systemic pressures, so the RV wall is thin.
    • Thin wall plus a low-resistance circuit means the RV is very sensitive to afterload. A sudden rise (PE, hypoxia, acidosis, high airway pressure) can make it dilate and fail. It copes with extra volume much better than with extra pressure.
    • It shares the septum with the LV. Normally the LV indents the RV, and LV contraction helps the RV eject. So LV function affects RV function, and the reverse.
    Why this matters at induction

    When the RV dilates, the septum moves towards the LV, LV filling falls and cardiac output falls. Low systemic pressure then reduces RV coronary perfusion, and the RV gets worse. Positive-pressure ventilation raises RV afterload. With a big, poorly contracting RV: support the blood pressure first, avoid reflex fluid boluses, and get senior help before you induce.

    How to tell which ventricle is which

    • The tricuspid annulus sits slightly closer to the apex than the mitral annulus.
    • The moderator band crosses the RV near its apex.
    • The LV normally forms the apex.

    Physiology statements are general teaching, not patient-specific advice.

    Concept diagram · short-axis relationship

    LVRV Free wall Shared septum Crescent RV, round LV (not to scale)

    Conceptual anatomy, not a sonogram. A single 2D slice cannot capture the whole RV, which is why you need several windows.

    Shape changes with load

    Normal RVDilated RV
    Apical viewTriangular, smaller than the LVRounded; may reach or form the apex
    Short axisCrescent; round LVLarger crescent; septum may flatten (D-shaped LV)

    RV · Windows

    Four windows. Find the RV in each.

    No single view shows the whole RV. Use each window for what it does best, and always compare the RV with the LV in the same view.

    WindowWhere the RV isUse it for
    Parasternal long axisRV outflow at the top of the screen, in front of the aortic rootA first look at RV size
    Parasternal short axisCrescent around the LV; at the aortic-valve level it wraps around the aortic valve from tricuspid valve (inflow) to pulmonary valve (outflow)Septal shape (mid-papillary level); inflow and outflow
    Apical four-chamber, RV-focusedOn the left of the screen, with the free wall at the edge of the sectorSize compared with the LV, basal diameter, FAC, TAPSE
    Subcostal four-chamberNearest the liver, free wall at the topFree-wall thickness; when apical views are poor or the patient is ventilated

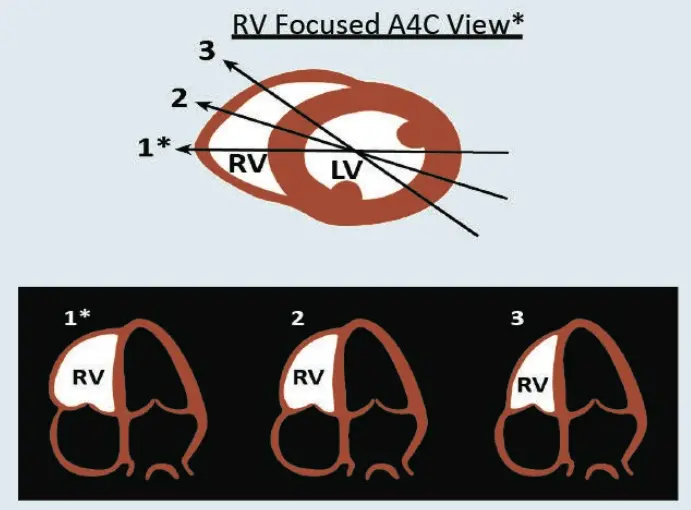
    Get an RV-focused apical view

    1. Obtain a standard A4C.
    2. Rock the probe slightly towards the RV so that it sits in the middle of the sector.
    3. Rotate until the RV is at its widest and you see the whole free wall and the tricuspid annulus. Keep the LV apex in view.
    4. Avoid clipping the lateral wall or cutting obliquely across the chamber: an off-axis plane undersizes the RV.
    How a standard A4C can mislead

    A view centred on the LV may show only part of the RV. Rotating the plane changes the apparent size and area. Use the same RV-focused plane, at comparable loading, for serial measurements.

    Schematic: three apical planes through the heart. Plane 1, the RV-focused view, shows the widest RV; planes 2 and 3 progressively undersize it.
    RV-focused A4C. Plane 1 cuts the RV at its widest. Planes 2 and 3 make the same RV look smaller. Image: SCCM Critical Care Ultrasound: Adult, used with permission
    Standard A4C. The view is centred on the LV. Clip: SCCM Critical Care Ultrasound: Adult, used with permission
    RV-focused A4C, same patient. Rock and rotate until the RV free wall and tricuspid annulus are fully seen. Clip: SCCM Critical Care Ultrasound: Adult, used with permission

    The other windows

    Parasternal long axis, normal. The RV outflow sits at the top of the sector, in front of the aortic root. Clip: SCCM Critical Care Ultrasound: Adult, used with permission
    Apical four-chamber, normal. The RV is smaller than the LV and the LV forms the apex. Clip: SCCM Critical Care Ultrasound: Adult, used with permission
    Subcostal four-chamber, normal. The RV free wall lies just under the liver. This is the best view for measuring wall thickness. Clip: SCCM Critical Care Ultrasound: Adult, used with permission
    Schematic: tilting the probe from the parasternal short-axis window sweeps through the pulmonary artery, aortic, mitral, papillary muscle and apical levels.
    Parasternal short axis: tilt from base to apex. Pulmonary artery, aortic valve, mitral valve, papillary muscle and apical levels. Judge septal shape at the papillary muscle level. Image: SCCM Critical Care Ultrasound: Adult, used with permission
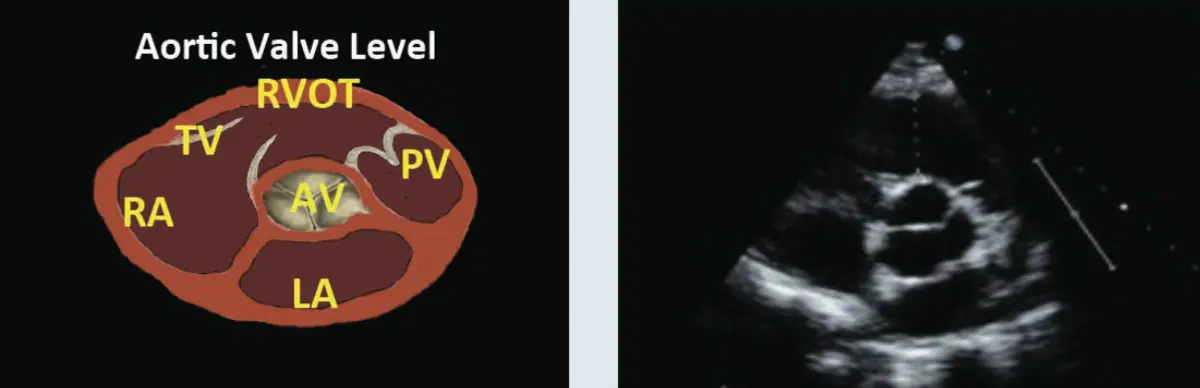
    Schematic and matching still at the aortic valve level: right atrium, tricuspid valve, RV outflow tract and pulmonary valve wrap around the central aortic valve, with the left atrium below.
    Aortic valve level. RA → tricuspid valve → RV outflow tract → pulmonary valve, wrapping around the aortic valve. Image: SCCM Critical Care Ultrasound: Adult, used with permission

    RV · Morphology

    Size first, then wall thickness.

    Size, at end-diastole

    Start with the eyeball. In an RV-focused A4C the normal RV is smaller than the LV and the LV forms the apex. If the RV is dilated, also look for an enlarged right atrium.

    Eyeball grading · end-diastolic area, RV compared with LV in A4C
    RV areaGrade
    More than 0.6 × LV areaDilated
    Equal to LV areaModerately dilated
    Larger than LV areaSeverely dilated

    These are area comparisons. Do not apply them to diameters: a basal RV:LV diameter ratio of 1.0 or more is a separate marker used in acute PE (see RV patterns).

    Linear dimensions · RV-focused A4C, end-diastole
    MeasurementReference
    Basal diameter (the one most used)Normal <41 mm (ASE 2025); >41 mm is dilated
    Mid-cavity diameter>35 mm is dilated (older value)
    Base-to-apex length>83 mm is dilated (older value)

    The mid-cavity and length cut-offs are the 2015 ASE chamber-quantification limits and have not been checked against the 2025 guideline. Use them as a guide, not for formal reporting. A single diameter never describes the whole RV.

    Normal Normal RV, A4C. Smaller than the LV; the LV forms the apex. Clip: SCCM Critical Care Ultrasound: Adult, used with permission
    Abnormal Dilated, poorly contracting RV, A4C. Compare the RV with the LV and see which chamber forms the apex. The diagnosis was acute PE. Clip: SCCM Critical Care Ultrasound: Adult, used with permission
    Normal Normal RV, PLAX. A narrow RV outflow in front of the aortic root. Clip: SCCM Critical Care Ultrasound: Adult, used with permission
    Abnormal Dilated, poorly contracting RV, PLAX. The RV outflow at the top of the sector is enlarged. Clip: SCCM Critical Care Ultrasound: Adult, used with permission
    Normal Normal RV, PSAX at the aortic valve. The RV inflow and outflow wrap closely around the aortic valve. Clip: SCCM Critical Care Ultrasound: Adult, used with permission
    Abnormal Dilated RV, PSAX at the aortic valve. The RV inflow and outflow are enlarged around the aortic valve. Clip: SCCM Critical Care Ultrasound: Adult, used with permission
    Normal Normal RV, PSAX. A thin crescent around a round LV. Clip: SCCM Critical Care Ultrasound: Adult, used with permission
    Abnormal Dilated, poorly contracting RV, PSAX. Compare the size of the RV crescent with the LV. Clip: SCCM Critical Care Ultrasound: Adult, used with permission

    Free-wall thickness

    1. Use the subcostal view at end-diastole, in 2D or M-mode, at the level of the anterior tricuspid leaflet.
    2. Keep the beam perpendicular to the free wall.
    3. Exclude trabeculations, papillary muscles and epicardial fat.
    Free wallInterpretation
    About 3 mm (±1)Normal
    >5 mmRV hypertrophy
    >10 mmSevere RV hypertrophy

    A thick wall points to a chronic pressure load such as pulmonary hypertension. Restrictive and infiltrative cardiomyopathies also thicken it. Thickening cannot date the current deterioration or exclude acute-on-chronic disease: compare with old studies and the history.

    >5 mm for hypertrophy matches current teaching. The 3 ± 1 mm normal and >10 mm severe grades are older values, not checked against the 2025 guideline.

    Subcostal still showing a markedly thickened RV free wall beneath the liver.
    Severe RV hypertrophy, subcostal. The free wall under the liver is markedly thick, labelled >10 mm in the source. No calipers are shown. Image: SCCM Critical Care Ultrasound: Adult, used with permission

    Current basal reference: ASE right-heart guideline 2025 (doi:10.1016/j.echo.2025.01.006).

    RV · Function

    Eyeball first. FAC and TAPSE measure different things.

    Start by watching the free wall: does it move in towards the septum, and does the tricuspid annulus move towards the apex? Then put numbers on it: FAC, then TAPSE, then RV output (RVOT VTI, which is beyond FoCUS and not taught here).

    Fractional area change

    In the same complete RV-focused A4C, trace the endocardial boundary at end-diastole and end-systole, including trabeculations within the cavity. Trace from the annulus along the free wall to the apex and back along the septum. Keep the whole contour visible.

    FAC = (EDA − ESA) / EDA × 100%

    FAC describes a change in projected area. It omits the RV outflow tract and is sensitive to tracing and plane. The 2025 ASE normal reference is >35%; FAC is not a direct measurement of RVEF.

    TAPSE

    Align the M-mode cursor with lateral tricuspid annular motion in an apical view. Measure the base-to-peak systolic excursion, rather than a chamber length or a tissue-Doppler velocity.

    The 2025 ASE normal reference is >17 mm. TAPSE is angle- and load-dependent and mainly reflects basal longitudinal function. Translation and tethering can preserve excursion despite impaired global performance.

    Why do older sources give a different TAPSE number?

    Older teaching calls TAPSE ≤16 mm, or <16 mm, highly suggestive of RV dysfunction, with FAC <35% for dysfunction. This page uses the 2025 ASE normal references (TAPSE >17 mm, FAC >35%). Interpret values near the cut-off with FAC, size, free-wall motion, septal shape and the clinical state.

    Current references: ASE right-heart guideline 2025.

    Measurement lab · schematic, independent inputs

    FAC and excursion are independent inputs to demonstrate disagreement; the model does not predict how a patient responds. Area outlines scale with the entered areas. The cosine example isolates alignment error and does not recommend electronic angle correction. Change the window and cursor alignment at acquisition.

    Real examples

    Apical four-chamber, poor RV function. Watch the free wall and the tricuspid annulus: compare their movement with the LV. This example is an RV infarction. Clip: SCCM Critical Care Ultrasound: Adult, used with permission
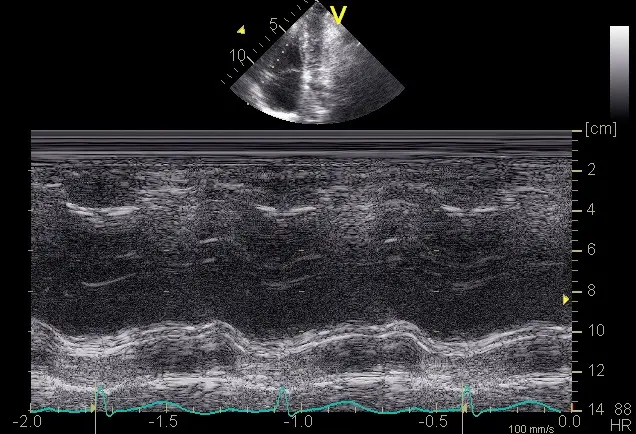
    M-mode through the lateral tricuspid annulus showing a large systolic excursion of the annular trace.
    TAPSE, normal. This trace measured 28 mm. Measure from the lowest to the highest point of the annular trace in one beat. Image: SCCM Critical Care Ultrasound: Adult, used with permission
    M-mode through the lateral tricuspid annulus showing a small systolic excursion of the annular trace.
    TAPSE, reduced. This trace measured 12 mm. Note the flatter annular trace. Image: SCCM Critical Care Ultrasound: Adult, used with permission

    RV · Septal interaction

    When does the septum go flat?

    In a true parasternal short axis at the papillary muscle level, the LV is round through the whole cycle. A loaded RV pushes the septum towards the LV and makes it a D. The timing tells you which kind of load.

    Septum flat inSuggestsFor example
    SystoleRV pressure overloadPE, pulmonary hypertension, ARDS or high airway pressure
    Diastole onlyRV volume overloadSevere tricuspid regurgitation, atrial septal defect
    Systole and diastoleCombined pressure and volume overloadPulmonary hypertension with significant TR

    Severe pressure overload alone can keep the septum flat into early diastole, so judge the frame at end-systole carefully.

    How to time it

    • Freeze and step frame by frame; use the ECG if you have one.
    • End-diastole: the frame at the QRS, as the mitral valve closes.
    • End-systole: the smallest LV cavity, just before the mitral valve opens.
    • Check the plane first. An oblique cut makes a normal LV look oval and fakes a D.

    Practise the timing in the RV patterns lab: choose Chronic PH or RV volume overload, then freeze systole and diastole.

    PSAX, flattening in systole and diastole. Step through one beat: the LV stays D-shaped at both end-systole and end-diastole. Clip: SCCM Critical Care Ultrasound: Adult, used with permission
    PSAX, flattening in diastole. The septum flattens in diastole and the LV rounds out again in systole, the volume-overload pattern. Clip: SCCM Critical Care Ultrasound: Adult, used with permission

    RV · Clip questions

    Five patients, real clips.

    Watch the clip, commit to an answer, then read why. Clips loop; use the controls to slow down or pause.

    Question 1 clip. Watch the RV free wall and the adjacent LV. Clip: SCCM Critical Care Ultrasound: Adult, used with permission

    Question 1

    What does this clip show?

    Commit to an answer to see the explanation.

    Question 2 clip, short axis. Look at the size of the RV and the shape of the septum. Clip: SCCM Critical Care Ultrasound: Adult, used with permission

    Question 2

    A 42-year-old woman with known pulmonary hypertension becomes shocked after aspiration in the operating room. What does this clip show?

    Commit to an answer to see the explanation.

    Case for questions 3 and 4

    A 20-year-old is found unconscious with a GCS of 9 and does not respond to naloxone. BP 90/48 mmHg, HR 132/min, RR 26/min. After 1 L of IV fluid: BP 118/70, HR 112, RR 20, GCS 13. Arterial gas 7.26 / 32 / 79 (pH / PaCO₂ / PaO₂ in mmHg). SpO₂ 89% on room air. Lactate 4.7. Troponin rises from 0.7 to 3.4. Urine toxicology is positive for cocaine.

    The source gives lactate as 4.7 mg/dL, which is probably a unit error (4.7 mmol/L would be raised). Troponin has no units in the source. Read both as given, not as exact values.

    Question 3 and 4 clip, A4C. Compare RV and LV size, and watch the free wall. Clip: SCCM Critical Care Ultrasound: Adult, used with permission
    Question 3 and 4 clip, PSAX. Look at the RV crescent and the septum. Clip: SCCM Critical Care Ultrasound: Adult, used with permission

    Question 3

    Which RV findings do these clips show?

    Commit to an answer to see the explanation.

    Same clips as question 3.

    Question 4

    Using the same clips, which diagnosis is the RV dysfunction most consistent with?

    Commit to an answer to see the explanation.

    Question 5 clip, PSAX. Septal shape. Clip: SCCM Critical Care Ultrasound: Adult, used with permission
    Question 5 clip, PLAX. RV outflow size. Clip: SCCM Critical Care Ultrasound: Adult, used with permission
    Question 5 clip, A4C. RV size and the RV apex. Clip: SCCM Critical Care Ultrasound: Adult, used with permission

    Question 5

    An 84-year-old man with urosepsis needs noradrenaline to support his MAP and is on nasal-cannula oxygen. What do these clips show?

    Commit to an answer to see the explanation.

    RV · Integrated patterns and pitfalls

    Review RV windows → · Practise FAC and TAPSE → · Real-clip questions →

    Is the RV big? Is the septum flat? Is it moving?

    Size · A4C at end-diastole, basal diameter compared with the LV
    • The RV normally appears smaller than the LV, roughly no more than two-thirds its size. A basal RV:LV diameter ratio ≥1 is concerning in acute PE. Do not apply area-ratio cut-offs to diameter measurements.
    • ESC 2019 PE guideline: an RV/LV diameter ratio ≥1.0 is a marker of RV dysfunction. The 2026 AHA/ACC PE guideline includes RV size, RV/LV ratio, TAPSE and TR velocity. In confirmed acute PE with an elevated clinical severity score but no persistent hypotension or shock (categories C–D), it favours echo over CT for short-term risk stratification. This is not a preference for diagnosing PE. Echo signs of RV strain do not diagnose PE: confirm it with dedicated PE imaging.
    • Use an RV-focused A4C at end-diastole for size: the 2025 ASE normal basal diameter is <41 mm. Include the whole free wall; foreshortening changes the measurement.
    • Check the RV apex: a normal LV forms the cardiac apex. An RV that reaches the apex is dilated.
    Shape · PSAX septal position
    • D-sign in systole, sometimes persisting into early diastole → pressure overload (PE, pulmonary hypertension, ARDS/high PEEP).
    • D-sign in diastole only → volume overload (e.g. ASD, severe TR).
    • Flat in both systole and diastole → combined pressure and volume overload. See real clips →
    • Paradoxical septal motion towards the LV.
    Function
    • TAPSE: M-mode at the lateral tricuspid annulus in A4C; longitudinal excursion of the annulus. Normal >17 mm (ASE 2025). Borderline values need context. Angle- and load-dependent; measures basal longitudinal motion, not global RVEF.
    • S′ >9.5 cm/s; FAC >35% are the 2025 ASE normal references. S′ samples lateral annular systolic velocity. FAC = (end-diastolic area − end-systolic area) / end-diastolic area × 100; it needs a complete RV contour and omits the RVOT.
    • Integrate size, free-wall thickening, septal shape and multiple function measures. Preserved TAPSE or S′ alone does not prove a normal RV.
    • McConnell sign: akinesis of the mid RV free wall with preserved apical motion. Reported with acute PE, but also RV infarction and other RV disease. Neither this sign nor a normal FoCUS confirms or excludes PE.
    FeatureAcute (e.g. high-risk PE)Chronic (pulmonary hypertension)
    RV free wallThin (≤5 mm)Hypertrophied (>5 mm)
    TR peak velocityMay be modest despite severe illness; no single pressure cut-off reliably dates the diseaseOften high
    RAMildly dilatedLarge
    ClinicalSuddenLong history, often known

    Thickening and marked pressure elevation support chronic adaptation; their absence does not prove an acute process. Acute-on-chronic disease is common. Measure wall thickness at end-diastole, excluding fat and trabeculations. Estimate PASP ≈ 4 × (peak TR velocity)² + RAP (from the IVC), e.g. TR 3.0 m/s → 36 + 8 = 44 mmHg (ASE right heart guideline 2025).

    Sim 5 · RV lab
    A4C · RV:LV at end-diastole
    PSAX · septal shape
    M-mode · lateral tricuspid annulus (TAPSE)
    Part IV · Pericardium and shock patterns

    Effusion, tamponade and the pump in shock.

    Is there fluid where it shouldn't be? Then put the LV, RV and pericardium together: which pump pattern explains the shock?

    Schematic subcostal four-chamber view with a moderate circumferential pericardial effusion between the liver and the RV free wall.
    Pericardium · Effusion and tamponade

    Pericardial or pleural? The descending aorta decides.

    Pericardial effusion · an anechoic space between epicardium and parietal pericardium
    • In PLAX, pericardial fluid lies anterior to the descending aorta and usually tapers at the posterior AV groove; it rarely tracks far behind the LA (oblique sinus).
    • Pleural effusion lies posterior to the descending aorta, extends beyond the heart, and may contain a 'jellyfish' of collapsed lung.
    • Epicardial fat: commonly anterior, grainy or speckled, and moves with the heart. Location alone cannot distinguish fat from fluid or clot; inspect texture and multiple views.
    • Size (end-diastole, ESC 2015): small <10 mm, moderate 10–20 mm, large >20 mm.
    • Circumferential or loculated? Loculated effusions are common after cardiac surgery and can compress only one chamber.
    Tamponade physiology · the low-pressure chambers collapse first
    • RA systolic collapse (inversion at end-diastole to early systole): the earliest and most sensitive sign. Collapse lasting more than one-third of the cardiac cycle is more specific.
    • RV diastolic collapse (free wall pushed in during early diastole): less sensitive but more specific.
    • Plethoric IVC (>2.1 cm, <50% respiratory change): very sensitive (present in >90% of tamponade), poorly specific. A small or collapsing IVC does not exclude low-pressure or localised tamponade.
    • Swinging heart (electrical alternans on ECG) with large effusions.
    • Advanced: exaggerated respiratory variation in mitral (>25%) and tricuspid (>40%) inflow on pulsed-wave Doppler.
    Tamponade is a clinical diagnosis (hypotension, tachycardia, raised JVP, pulsus paradoxus) that ultrasound supports and speeds up. Small but rapid effusions (trauma, post-procedure) can tamponade. Large chronic ones may not.
    Pitfalls and management
    • Pulmonary hypertension or RV hypertrophy: the RV may not collapse.
    • Hypovolaemia: 'low-pressure tamponade' with a non-plethoric IVC.
    • After cardiac surgery, localised fluid or clot may compress one chamber without a circumferential effusion or classic right-sided collapse. A reassuring limited TTE does not exclude tamponade: seek urgent expert assessment, often TOE when TTE is inadequate.
    • Positive-pressure ventilation alters respiratory variation.
    • Use the ECG or M-mode to time collapse to systole or diastole.
    • If tamponade is likely, prepare for drainage (echo-guided pericardiocentesis or surgery). Avoid induction and positive-pressure ventilation if at all possible. Give a modest fluid bolus as a bridge only.
    Sim 6 · Fluid around the heart
    Real scan · Pericardial effusion

    Real A4C cine from a published tamponade teaching case: recognise pericardial fluid and inspect right-sided chamber motion. Confirm collapse timing with ECG/M-mode and integrate haemodynamics; effusion alone does not diagnose tamponade.

    Source and licence

    Ben Smith, Ultrasound of the Week. Original clip → · CC BY-SA 4.0. Adaptation: H.264 transcode, metadata removed and poster extracted.

    Shock · Putting LV and RV together

    Pump patterns in shock.

    Combine LV, RV, IVC and effusion into a pattern, then act. (See RUSH / shock for the full pump–tank–pipes approach.) Tap a row to see it.

    PatternLVRVIVCThink
    Hypo­volaemic / distrib­utiveSmall, hyper­dynamic, end-systolic oblit­erationNormal or smallSmall, >50% collapseBleeding, dehydration, sepsis, neuraxial block, anaphylaxis
    Cardio­genic (LV)Dilated, poorNormal or second­arily impairedPleth­oricACS, cardiomyopathy, myocarditis. Look for B-lines (lung)
    Ob­structive (RV)Small, under­filled, D-shapedDilated, poor, D-signPleth­oricPE, high PEEP / ARDS (acute cor pulmonale). Check the legs (DVT)
    Ob­structive (tam­ponade)Small, may be hyper­dynamicDiastolic collapsePleth­oric, fixedPericardial effusion
    Dynamic LVOT obstructionSmall, hyper­dynamic, thickNormalSmallSAM of the mitral valve. Additional inotropy can worsen obstruction. Confirm with expert echo and Doppler; adjust inotropy, vascular tone and heart rate to the physiology. Fluid requires assessment of perfusion need and congestion.

    Tension pneumothorax is obstructive shock with small, underfilled, hyperdynamic chambers and a plethoric IVC; the heart may be hard to see. Assess the pleura and clinical state; absent sliding alone is nonspecific. Suspected clinical tension requires immediate decompression without waiting for a lung point (see lung).

    Heart
    IVC · long axis
    Two rules
    • A big RV in shock is a reason to reassess further fluid. Over-distending the RV pushes the septum into the LV and lowers output.
    • A small, hyperdynamic LV does not prove hypovolaemia. A vasodilated patient looks the same. Use the IVC, clinical context and the response to a passive leg raise.
    Limits · Red flags and limits

    See the red flag, then hand it to an echocardiographer.

    Gross valve and structural red flags: recognise and refer, don't grade
    • Heavily calcified, immobile aortic valve with restricted opening, ± LV hypertrophy: suspect severe aortic stenosis. This matters before a spinal or induction (keep SVR and sinus rhythm; avoid tachycardia).
    • Flail mitral leaflet / ruptured papillary muscle: leaflet tip prolapses into the LA, with a new murmur after MI. Also look for a new VSD (septal defect with flow on colour Doppler).
    • Dynamic LVOT obstruction with SAM: the anterior mitral leaflet moves towards the septum in systole, in a small, hyperdynamic, hypertrophied LV. Inotropes, tachycardia and hypovolaemia make it worse.
    • Large, mobile mass: vegetation, LV apical thrombus, thrombus in transit in the RA/RV.
    • Dilated aortic root (>about 4 cm in PLAX) or an intimal flap with pericardial effusion: suspect type A dissection.
    • Colour Doppler: a big, wide regurgitant jet filling much of an atrium is a red flag, not a grade.
    • Prosthetic valve that looks rocking or immobile.
    Echo in cardiac arrest
    • Get the probe on (subcostal) during compressions. Record a clip at the pulse check and review it after CPR restarts; keep each pause under 10 s, with someone counting aloud.
    • Look for organised wall motion (pseudo-PEA: treat as profound shock), standstill, a large effusion, or an empty heart. A dilated RV is common after any arrest, so it does not prove PE on its own.
    • Ultrasound must not lengthen pauses in compressions; if it does, stop scanning.
    FoCUS pitfalls
    • An off-axis or foreshortened view makes structures look the wrong size or shape.
    • Grading the LV on one view.
    • Calling a D-sign on an oval PSAX.
    • Fat called as effusion; pleural fluid called as pericardial.
    • Aorta called as IVC.
    • Anchoring: the scan looked 'normal', so the shock must be distributive.
    • Vasopressors and inotropes change what you see, so rescan after a change.
    When to call for a formal echo (TTE/TOE)
    • Image quality is inadequate to answer the question.
    • An unexpected finding: valve red flag, mass, regional wall motion abnormality, dilated aortic root.
    • The finding doesn't fit the clinical picture, or the patient is not improving as expected.
    • Quantification is needed (LVEF, valve gradients, PASP, diastolic function).
    • Suspected endocarditis, dissection, mechanical complications of MI, or prosthetic valve dysfunction. These usually need TOE.

    Document: views obtained, image quality, findings as answers to the five questions, and your limitations.

    Part V · Extension

    Fluids and congestion.

    Will more fluid help, and can the patient tolerate it? These four sections go beyond the core FoCUS questions.

    They are covered in more depth, with the measurement maths and error, in the Flow and fluids lecture.

    Extension · IVC and fluid responsiveness

    The IVC tells you about RA pressure. Whether stroke volume will rise is a different question.

    Spontaneously breathing: estimating RA pressure (ASE 2025, unchanged from Rudski 2010)
    IVC diameterCollapse with sniffEstimated RAP
    ≤2.1 cm>50%3 mmHg (0–5)
    ≤2.1 cm<50%8 mmHg (5–10)
    >2.1 cm>50%8 mmHg (5–10)
    >2.1 cm<50%15 mmHg (10–20)
    Collapsibility index = (Dmax − Dmin) / Dmax
    Fluid responsiveness: stroke volume rises by about 10–15% after a fluid challenge
    • Mechanically ventilated, fully passive: the IVC distends with each positive-pressure breath. Distensibility index (Dmax − Dmin)/Dmin >18% predicted response (Barbier 2004). ΔIVC (Dmax − Dmin)/mean >12% predicted response (Feissel 2004). Overall accuracy of IVC variation is only moderate (meta-analysis in ventilated shocked patients: pooled sensitivity 69%, specificity 80%, AUROC 0.82; Huang 2018); use it as one input, not a test.
    • Valid only with no spontaneous breathing effort, tidal volume about ≥8 mL/kg predicted body weight in the original studies and no raised intra-abdominal pressure; a regular rhythm helps. Do not increase tidal volume solely to make this test applicable.
    • Spontaneously breathing: much weaker. A large collapse (e.g. ≥40–50%) makes response likely, but a small collapse does not rule it out (high specificity, low sensitivity; Airapetian 2015). Breathing effort varies breath to breath.
    The useful extremes
    • A small, collapsing IVC may support low right-sided filling pressure. It does not establish hypovolaemia, fluid responsiveness or fluid tolerance; assess the heart, lungs and response to a reversible preload test.
    • A plethoric, minimally varying IVC raises concern for elevated right-sided pressure. Seek the cause (RV failure, obstruction, TR, positive-pressure ventilation or congestion); it cannot by itself determine whether fluid will help.
    • The middle ground is uninformative. Use a passive leg raise with VTI (next slide).
    Caveats

    Raised intra-abdominal pressure compresses the IVC. RV failure, TR or tamponade distend it whatever the volume status. High PEEP dilates it. Forceful breathing exaggerates collapse. The cylinder effect and translational movement fake collapse. Athletes can have a large IVC. Being fluid-responsive is not a reason to give fluid. It must also be needed and safe.

    Real IVC clips, the IVC pitfalls and three shocked patients are in Flow and fluids: IVC pitfalls → · static measures →

    Sim 7 · IVC
    Extension · LVOT VTI and PLR

    Measure stroke volume, give a fluid challenge with no fluid, measure again.

    LVOT VTI (velocity–time integral)
    • Take an apical 5-chamber view (tilt anteriorly from A4C). Place the pulsed-wave gate in laminar LVOT flow just proximal to the aortic valve, aligned with flow. Avoid the valve acceleration zone and trace the dense modal envelope, excluding faint spectral noise. Average representative beats.
    • VTI is the 'stroke distance' (cm). Stroke volume = VTI × LVOT area (π × (LVOT diameter/2)²).
    • VTI is a distance, not a volume. Interpret it with LVOT area and heart rate; a low VTI suggests low stroke volume only in the relevant geometry. Significant aortic regurgitation can make systolic LVOT flow exceed net systemic flow.
    • Use trends in VTI. Keep the same gate position and angle for repeat measurements.
    Passive leg raise (PLR)
    • Start semi-recumbent at 45°. Lower the trunk flat and raise the legs to 45° in one movement. This returns about 300 mL of venous blood, reversibly.
    • Capture the maximum flow change promptly, usually within about a minute; the response can fade. Return to the original position and confirm recovery towards baseline.
    • A rise of ≥10% predicts fluid responsiveness. Pooled sensitivity 85%, specificity 91%, AUROC 0.95 for cardiac output changes (Monnet 2016 meta-analysis). In spontaneously breathing patients, a PLR-induced rise in stroke volume (from LVOT VTI) ≥12.5% predicted response: sensitivity 77%, specificity 100% (Lamia 2007).
    • Measure flow, not blood pressure: pulse pressure changes after PLR are much less sensitive.
    • Pitfalls: pain, coughing or waking increase sympathetic tone and give a false positive. Raised intra-abdominal pressure can give a false negative. Not suitable with raised ICP or with unstable spine or leg fractures. Start from semi-recumbent: starting supine recruits less volume.
    If flow rises reproducibly with PLR, fluid may help only when there is an indication and acceptable risk. Real A5C and VTI examples, measurement error and fluid decisions → On the ventilator, see aortic peak velocity variation.
    Sim 8 · VTI and PLR
    A5C · PW gate in the LVOT
    Posture · 0 s
    Pulsed-wave Doppler · LVOT
    Extension · Fluid tolerance and VExUS

    Will the patient respond to fluid? Will they tolerate it? These are separate questions.

    Responsiveness vs tolerance
    • Fluid responsiveness: stroke volume rises with a fluid challenge (previous two slides). It tells you fluid could help.
    • Fluid tolerance: the patient can take more fluid without harm from venous congestion or oedema (Kattan 2022). A patient can be both responsive and intolerant, for example a septic patient with ARDS or capillary leak, or with intra-abdominal hypertension, whose stroke volume still rises with fluid. A congested, failing RV is usually neither responsive nor tolerant.
    • High right atrial pressure is transmitted back to the liver, gut and kidneys. Venous congestion lowers the organ perfusion gradient, and the kidney is especially vulnerable.
    • VExUS (venous excess ultrasound; Beaubien-Souligny 2020) grades how far that pressure reaches the organs, using the IVC plus three venous Doppler waveforms.
    The three Doppler patterns (time each one against the ECG)
    VeinNormalMildSevere
    Hepatic veinS > DS < D (S still towards the heart)S reversed
    Portal vein pulsatility<30%30–49%≥50%
    Intrarenal veinContinuousDiscontinuous, biphasic (S and D)Discontinuous, monophasic (D only)
    Portal pulsatility fraction = (Vmax − Vmin) / Vmax × 100
    The grade
    Grade 0IVC <2 cm: no congestion by this grading scheme (Doppler not needed for the grade)
    Grade 1IVC ≥2 cm with normal and/or mildly abnormal patterns only: mild
    Grade 2IVC ≥2 cm with one severely abnormal pattern: moderate
    Grade 3IVC ≥2 cm with two or more severely abnormal patterns: severe

    Grading as published (VExUS 'C' prototype, Beaubien-Souligny 2020). Only severe patterns raise the grade above 1.

    Sim 9 · VExUS calculator
    IVC (max diameter)
    Hepatic vein · PW Doppler · towards the heart is below the baseline
    Portal vein · PW Doppler · towards the liver is above the baseline
    Intrarenal (interlobar) · artery above, vein below the baseline
    Schematic, not a real scan. Waveforms are drawn for teaching; real tracings are noisier and vary with respiration.
    Extension · VExUS in practice

    Four looks, one ECG, and a lot of caveats.

    Acquisition: phased-array or curvilinear probe, ECG trace on, breath held if possible
    LookHow
    IVCSubcostal long axis, about 1–2 cm from the cavo-atrial junction. Use the maximum diameter. In ventilated patients on PEEP the IVC is often ≥2 cm: rely on the Doppler patterns and state that the IVC step is confounded.
    Hepatic veinSubcostal or right intercostal view of a large hepatic vein (often the middle) near the IVC. Colour, then a PW gate in the vein. Name each wave against the ECG: S follows the QRS, D follows the T wave.
    Portal veinRight mid-axillary intercostal view, coronal plane: the portal vein runs through the liver with bright walls. PW gate in the main or right portal vein; measure Vmax and Vmin over one cycle.
    Intrarenal veinRight kidney, posterolateral approach. Colour Doppler with a low velocity scale to find interlobar vessels. A wide PW gate captures the artery above and the vein below the baseline. Use a slow sweep.
    Caveats: when the waveforms mislead
    • Atrial fibrillation: no A wave and a small S wave, so S < D is common at baseline. Interpret the hepatic vein with care.
    • Severe tricuspid regurgitation: the regurgitant jet itself reverses the hepatic S wave. The finding reflects the TR more than overall venous pressure, so grade on the portal and renal veins and the IVC too.
    • Cirrhosis or portal hypertension: a stiff liver flattens the hepatic vein waveform (often monophasic) and can damp or even reverse portal flow, whatever the RAP. Both hepatic and portal signals are unreliable; lean on the IVC, the renal vein and the echo.
    • Fit, thin, young people: portal pulsatility can be a normal variant. A pulsatile portal vein with a small IVC is grade 0.
    • CKD and renal parenchymal disease: intrarenal venous patterns are less reliable. This is also the hardest window; check you are not sampling the main renal vein.
    • Raised intra-abdominal pressure compresses the IVC and can alter the waveforms. High PEEP and chronic pulmonary hypertension raise RAP without volume excess.
    • VExUS shows pressure, not volume. It cannot tell RV failure from fluid overload: the echo does that.
    VExUS grading, step by step (schematic)
    IVC diameter <2 cm≥2 cm Grade 0IVC criterion absent Doppler × 3hepatic · portal · renalcount SEVERE patterns noneone≥2 Grade 1mild Grade 2moderate Grade 3severe Severe = hepatic S reversal · portal pulsatility ≥50% · monophasic (D-only) intrarenal venous flow
    What it does and does not predict
    • Derivation (145 patients after cardiac surgery): grade 3 predicted AKI, HR 3.69 (95% CI 1.65–8.24), 2.82 after adjustment. At ICU admission grade 3 was highly specific (96%) but insensitive (about 27%) (Beaubien-Souligny 2020).
    • General ICU (145 patients, multicentre): VExUS ≥2 in about one in five at admission and not associated with AKI or 28-day mortality (Andrei 2023). In sepsis (108 patients, four ICUs), VExUS ≥2 was not independently associated with AKI: adjusted OR 1.82 (0.62–5.31) (Song 2025).
    • Meta-analysis (9 observational studies, 1036 patients): VExUS ≥2 associated with AKI, OR 2.63 (1.06–6.54) with high heterogeneity; strongest after cardiac surgery (OR 3.86). No association with mortality (Melo 2025).
    • Physiology: grade correlated with right atrial pressure at catheterisation, better than IVC size alone (pilot study; Longino 2023).
    • Guiding treatment: in cardiorenal syndrome type 1 (RCT, 140 patients), VExUS-guided diuresis achieved decongestion more often, but kidney function recovery and 90-day survival did not differ (Islas-Rodríguez 2024). No trial yet shows better hard outcomes.
    Grade 2–3: reassess further fluid and identify the cause; the score alone is not a universal stop rule or an indication for diuresis. Integrate perfusion, lung findings and the echo (RV failure, PE, tamponade, tension pneumothorax, severe TR, high PEEP, fluid overload). Treat obstruction directly: drain tamponade, decompress a pneumothorax, reperfuse PE. Consider decongestion (diuretic or ultrafiltration) only when the cause is volume overload or RV/cardiorenal congestion, with perfusion pressure supported, then rescan: the waveforms improve as RAP falls. Grade 0 does not mean fluid will help: that is the PLR question.
    Part VI · Five patients

    Five shocked patients.

    For each patient, select the views, describe ventricular and pericardial findings, then explain the next action before revealing the discussion.

    Ask · Acquire · Assess · Act

    Clinical details are teaching vignettes; the case images are schematic simulations.

    Quick check

    Check your understanding.

    Tap an answer. The explanation appears straight away.

    Scan deliberately

    Thank you.

    Take home
    1. Ask a question you can answer. Get two views. Answer yes / no / can't tell.
    2. Start deep, use the cardiac preset, and keep the marker convention consistent.
    3. Judge LV thickening in multiple views. EF is a fraction, not cardiac output; EPSS and fractional shortening have important limits.
    4. A dilated RV with septal flattening has several causes. Consider PE, other pressure overload and volume overload; avoid reflex fluid boluses.
    5. The descending aorta separates pericardial from pleural fluid. RA collapse is sensitive and RV collapse is specific; tamponade is clinical.
    6. The IVC informs right-sided pressure. Use a valid flow-based dynamic test when fluid responsiveness matters.
    7. Responsiveness does not establish fluid need or tolerance. VExUS adds congestion information; interpret it with perfusion and the cause.
    8. FoCUS recognises red flags; formal echo grades them.

    Next: the WINFOCUS/ASE recommendations suggest a structured programme with logged scans and supervision before independent practice. Log your next five scans this week.

    Schematic · subcostal 4C
    Schematic · PSAX
    Key references

    Where the numbers come from.

    Key references (tap to collapse)
    1. Via G, Hussain A, Wells M, et al. International evidence-based recommendations for focused cardiac ultrasound. J Am Soc Echocardiogr. 2014;27(7):683.e1–683.e33. doi:10.1016/j.echo.2014.05.001
    2. Labovitz AJ, Noble VE, Bierig M, et al. Focused cardiac ultrasound in the emergent setting: a consensus statement of the American Society of Echocardiography and American College of Emergency Physicians. J Am Soc Echocardiogr. 2010;23(12):1225–30. doi:10.1016/j.echo.2010.10.005
    3. Spencer KT, Kimura BJ, Korcarz CE, Pellikka PA, Rahko PS, Siegel RJ. Focused cardiac ultrasound: recommendations from the American Society of Echocardiography. J Am Soc Echocardiogr. 2013;26(6):567–81. doi:10.1016/j.echo.2013.04.001
    4. Kirkpatrick JN, Panebianco N, Díaz-Gómez JL, et al. Recommendations for cardiac point-of-care ultrasound nomenclature. J Am Soc Echocardiogr. 2024;37(9):809–19. doi:10.1016/j.echo.2024.05.001
    5. Levitov A, Frankel HL, Blaivas M, et al. Guidelines for the appropriate use of bedside general and cardiac ultrasonography in the evaluation of critically ill patients—Part II: cardiac ultrasonography. Crit Care Med. 2016;44(6):1206–27. doi:10.1097/CCM.0000000000001847
    6. Díaz-Gómez JL, Sharif S, Ablordeppey E, et al. Society of Critical Care Medicine guidelines on adult critical care ultrasonography: focused update 2024. Crit Care Med. 2025;53(2):e447–e458. doi:10.1097/CCM.0000000000006530
    7. Lang RM, Badano LP, Mor-Avi V, et al. Recommendations for cardiac chamber quantification by echocardiography in adults: an update from the American Society of Echocardiography and the European Association of Cardiovascular Imaging. J Am Soc Echocardiogr. 2015;28(1):1–39.e14. doi:10.1016/j.echo.2014.10.003
    8. Mukherjee M, Rudski LG, Addetia K, et al. Guidelines for the echocardiographic assessment of the right heart in adults and special considerations in pulmonary hypertension: recommendations from the American Society of Echocardiography. J Am Soc Echocardiogr. 2025;38(3):141–86. doi:10.1016/j.echo.2025.01.006
    9. Rudski LG, Lai WW, Afilalo J, et al. Guidelines for the echocardiographic assessment of the right heart in adults: a report from the American Society of Echocardiography. J Am Soc Echocardiogr. 2010;23(7):685–713. doi:10.1016/j.echo.2010.05.010
    10. Konstantinides SV, Meyer G, Becattini C, et al. 2019 ESC Guidelines for the diagnosis and management of acute pulmonary embolism developed in collaboration with the European Respiratory Society (ERS). Eur Heart J. 2020;41(4):543–603. doi:10.1093/eurheartj/ehz405
    11. Creager MA, Barnes GD, Giri J, et al. 2026 AHA/ACC/ACCP/ACEP/CHEST/SCAI/SHM/SIR/SVM/SVN guideline for the evaluation and management of acute pulmonary embolism in adults. Circulation. 2026;153:e977–e1051. doi:10.1161/CIR.0000000000001415
    12. McConnell MV, Solomon SD, Rayan ME, Come PC, Goldhaber SZ, Lee RT. Regional right ventricular dysfunction detected by echocardiography in acute pulmonary embolism. Am J Cardiol. 1996;78(4):469–73. PMID 8752195
    13. Adler Y, Charron P, Imazio M, et al. 2015 ESC Guidelines for the diagnosis and management of pericardial diseases. Eur Heart J. 2015;36(42):2921–64. doi:10.1093/eurheartj/ehv318
    14. Schulz-Menger J, Collini V, Gröschel J, et al. 2025 ESC Guidelines for the management of myocarditis and pericarditis. Eur Heart J. 2025;46(40):3952–4041. doi:10.1093/eurheartj/ehaf192
    15. Himelman RB, Kircher B, Rockey DC, Schiller NB. Inferior vena cava plethora with blunted respiratory response: a sensitive echocardiographic sign of cardiac tamponade. J Am Coll Cardiol. 1988;12(6):1470–7. PMID 3192844
    16. McKaigney CJ, Krantz MJ, La Rocque CL, et al. E-point septal separation: a bedside tool for emergency physician assessment of left ventricular ejection fraction. Am J Emerg Med. 2014;32(6):493–7. doi:10.1016/j.ajem.2014.01.045
    17. Melamed R, Sprenkle MD, Ulstad VK, Herzog CA, Leatherman JW. Assessment of left ventricular function by intensivists using hand-held echocardiography. Chest. 2009;135(6):1416–20.
    18. Barbier C, Loubières Y, Schmit C, et al. Respiratory changes in inferior vena cava diameter are helpful in predicting fluid responsiveness in ventilated septic patients. Intensive Care Med. 2004;30(9):1740–6. doi:10.1007/s00134-004-2259-8
    19. Feissel M, Michard F, Faller JP, Teboul JL. The respiratory variation in inferior vena cava diameter as a guide to fluid therapy. Intensive Care Med. 2004;30(9):1834–7. doi:10.1007/s00134-004-2233-5
    20. Huang H, Shen Q, Liu Y, Xu H, Fang Y. Value of variation index of inferior vena cava diameter in predicting fluid responsiveness in patients with circulatory shock receiving mechanical ventilation: a systematic review and meta-analysis. Crit Care. 2018;22:204. doi:10.1186/s13054-018-2063-4
    21. Airapetian N, Maizel J, Alyamani O, et al. Does inferior vena cava respiratory variability predict fluid responsiveness in spontaneously breathing patients? Crit Care. 2015;19:400. doi:10.1186/s13054-015-1100-9
    22. Monnet X, Marik P, Teboul JL. Passive leg raising for predicting fluid responsiveness: a systematic review and meta-analysis. Intensive Care Med. 2016;42(12):1935–47. doi:10.1007/s00134-015-4134-1
    23. Lamia B, Ochagavia A, Monnet X, Chemla D, Richard C, Teboul JL. Echocardiographic prediction of volume responsiveness in critically ill patients with spontaneously breathing activity. Intensive Care Med. 2007;33(7):1125–32. doi:10.1007/s00134-007-0646-7
    24. Kattan E, Castro R, Miralles-Aguiar F, Hernández G, Rola P. The emerging concept of fluid tolerance: a position paper. J Crit Care. 2022;71:154070. doi:10.1016/j.jcrc.2022.154070
    25. Beaubien-Souligny W, Rola P, Haycock K, et al. Quantifying systemic congestion with point-of-care ultrasound: development of the venous excess ultrasound grading system. Ultrasound J. 2020;12:16. doi:10.1186/s13089-020-00163-w
    26. Andrei S, Bahr PA, Nguyen M, Bouhemad B, Guinot PG. Prevalence of systemic venous congestion assessed by Venous Excess Ultrasound Grading System (VExUS) and association with acute kidney injury in a general ICU cohort: a prospective multicentric study. Crit Care. 2023;27:224. doi:10.1186/s13054-023-04524-4
    27. Longino A, Martin K, Leyba K, et al. Correlation between the VExUS score and right atrial pressure: a pilot prospective observational study. Crit Care. 2023;27:205. doi:10.1186/s13054-023-04471-0
    28. Koratala A, et al. Unlocking the potential of VExUS in assessing venous congestion: the art of doing it right. Cardiorenal Med. 2024;14(1):350–74. doi:10.1159/000539469
    29. Islas-Rodríguez JP, et al. Effect on kidney function recovery guiding decongestion with VExUS in patients with cardiorenal syndrome 1: a randomized control trial. Cardiorenal Med. 2024;14(1):1–11. doi:10.1159/000535641
    30. Melo RH, Gioli-Pereira L, Melo E, Rola P. Venous excess ultrasound score association with acute kidney injury in critically ill patients: a systematic review and meta-analysis of observational studies. Ultrasound J. 2025;17:16. doi:10.1186/s13089-025-00413-9
    31. Song J, Chen G, Lai D, et al. Association between the Venous Excess Ultrasound (VExUS) score and acute kidney injury in critically ill patients with sepsis: a multicenter prospective observational study. Ann Intensive Care. 2025;15. doi:10.1186/s13613-025-01529-w
    32. Zoghbi WA, Adams D, Bonow RO, et al. Recommendations for noninvasive evaluation of native valvular regurgitation. J Am Soc Echocardiogr. 2017;30:303–371. Read the guideline →
    33. Nicoara A, Skubas N, Ad N, et al. Guidelines for the use of transesophageal echocardiography to assist with surgical decision-making in the operating room: a surgery-based approach. J Am Soc Echocardiogr. 2020;33:692–734. Read the guideline →
    34. Mitchell C, Rahko PS, Blauwet LA, et al. Guidelines for performing a comprehensive transthoracic echocardiographic examination in adults. J Am Soc Echocardiogr. 2019;32:1–64. Read the guideline →
    35. Monnet X, Teboul JL. Passive leg raising: five rules, not a drop of fluid! Crit Care. 2015;19:18. Read the methodology →
    36. Perera P, Mailhot T, Riley D, Mandavia D. The RUSH exam: Rapid Ultrasound in SHock in the evaluation of the critically ill. Emerg Med Clin North Am. 2010;28(1):29–56. doi:10.1016/j.emc.2009.09.010
    37. Society of Critical Care Medicine. Critical Care Ultrasound: Adult, LV and RV lectures. Clips and images used with permission.

    Simulations are purpose-built schematic teaching models, not diagnostic images. Anatomy, echogenicity, timing and thresholds are simplified. Check thresholds against current guidelines and local protocols.