POCUS · Haemodynamics
Flow and fluid assessment.
Measure flow. Test a response. Check the cost of more fluid.
A vigorous ventricle can deliver little blood. A positive passive leg raise can coexist with pulmonary oedema. This lecture separates those questions.
For adult perioperative and critical care practice. Start after Focused cardiac ultrasound; learn the windows before interpreting the numbers.
- Distinguish EF, stroke volume, cardiac output and perfusion.
- Acquire LVOT Doppler and recognise measurement error.
- Know why static measures (CVP, LVEDA, IVC size) predict response poorly.
- Perform and interpret a passive leg raise and respiratory variation indices.
- Combine dynamic response with lung and venous findings.
Four interactive labs and real clips. Change ventricular volume, regurgitation, Doppler angle and test timing. The labs are schematic teaching models; their outputs do not validate a patient measurement or prescribe treatment.
Static measures → · Aortic velocity → · Clip questions → · Sources →
01 · The decision
Three questions before a bolus.
| Question | What to establish | What cannot answer it alone |
|---|---|---|
| Need | Is tissue perfusion inadequate, and is fluid an appropriate way to improve it? | Hypotension, oliguria or lactate in isolation. |
| Response | Will greater preload raise stroke volume or cardiac output? | One IVC diameter, CVP or EF. |
| Tolerance | Will more fluid worsen pulmonary or systemic congestion? | A positive PLR or a small IVC. |
Assess the trajectory: mental state, capillary refill, skin temperature, urine output, lactate, arterial pressure and the suspected mechanism. These variables answer different questions and change at different speeds.
After initial resuscitation, persistent shock should prompt a valid assessment of fluid responsiveness before further fluid. A non-responsive circulation may need vasopressor support, an inotrope or treatment of obstruction; the scan helps identify which mechanism is plausible.
Responsive does not mean thirsty. A stable patient may be responsive without needing fluid. A patient with ARDS may be responsive but poorly tolerant.
Where the scan fits
| Question | Echo measures in this lecture |
|---|---|
| Volume status | IVC at end-expiration; LV end-diastolic area (static measures). |
| Response | LVOT VTI with PLR; aortic velocity and IVC variation on the ventilator; SVC collapsibility on TOE. |
| Tolerance | RV function, mitral inflow E velocity, lung and venous Doppler. |
Dynamic measures beat static ones. PLR is the best validated dynamic test, but none is perfect. Which one you use depends on your skills and the patient in front of you. A preload-dependent heart is a reason to give volume only if there is haemodynamic failure.
02 · Static measures
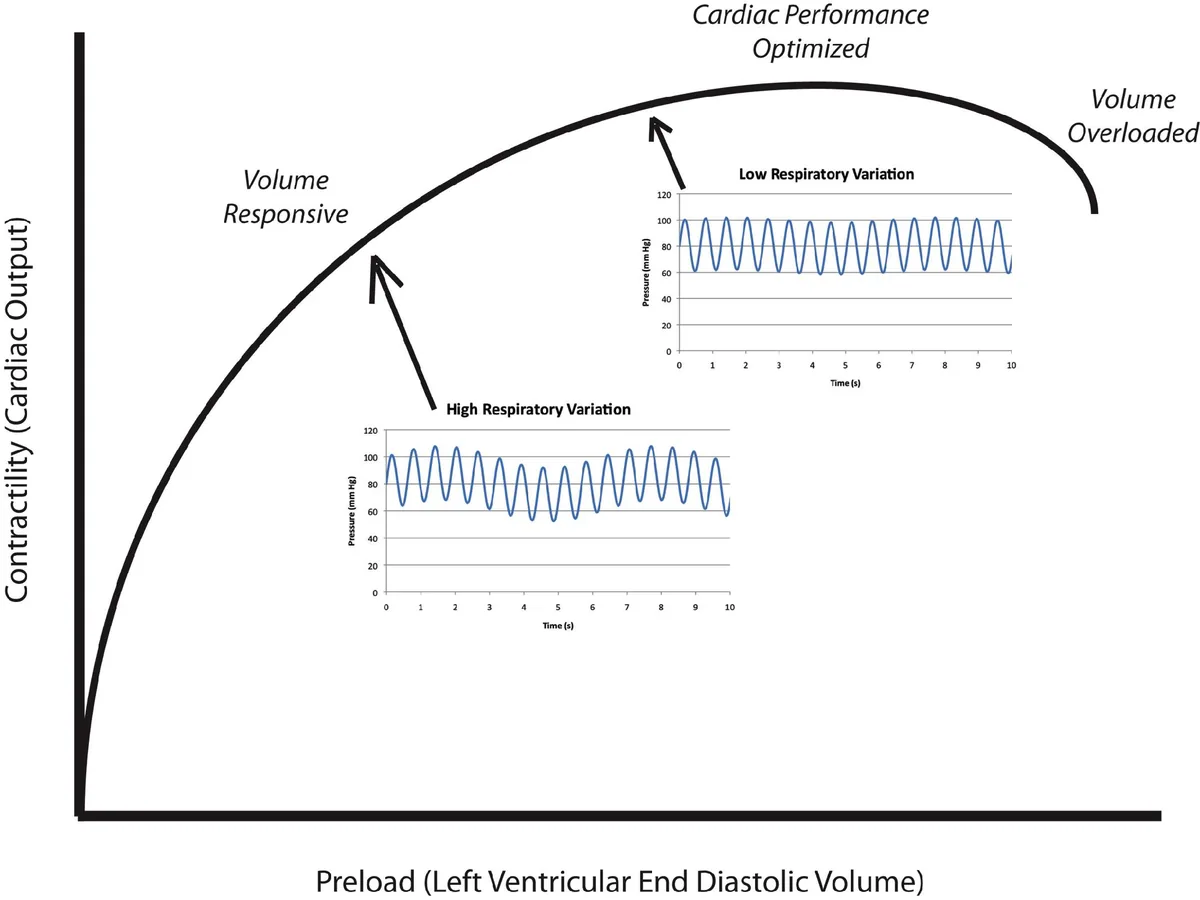
A snapshot of size cannot tell you where the heart sits on its curve.
Static measures describe how full a chamber or vein looks now. Whether stroke volume rises with more preload depends on the slope of that ventricle’s Frank–Starling curve, which a single snapshot cannot show. Use static values at the extremes, then test.
Central venous pressure
In Osman et al. (2007), CVP <8 mmHg and PAOP <12 mmHg predicted a response to a fluid challenge with positive predictive values of only 47% and 54%; a little better (61% and 69%) in patients with a stroke volume index <30 mL/m². A low CVP is often wrong about response; a normal or high CVP does not exclude it.
LV end-diastolic area (LVEDA)
- Parasternal short axis at the mid-papillary level, on axis: a round LV with both papillary muscles in view.
- Freeze at end-diastole (the largest frame, at the QRS) and trace the endocardial border, excluding the papillary muscles.
- Look at end-systole too: a tiny cavity with the papillary muscles touching (“kissing”) is the classic picture of low preload in a vigorous LV.
Older values (Leung 1994). Normal LVEDA 9.5–22 cm²; a very low LVEDA (<5.5 cm²/m² of body surface area) suggests hypovolaemia. The FUSA algorithm quotes <5.5 cm² without indexing. The unit used in the original study has not been checked, so read the number as an orientation, not a cut-off.
Pitfalls. Poor border definition and an oblique cut change the area. A stiff, hypertrophied LV is small and underfilled even when central venous volume is normal, so a small cavity with thick walls is not proof of hypovolaemia. A small, hyperdynamic LV in early sepsis can also obstruct its own outflow (pump patterns in shock).
IVC at end-expiration
In ventilated patients (Pinsky 2017 editorial), the end-expiratory IVC could be measured in 78% of patients. A diameter <13 mm predicted a response to fluid with a specificity of 80%, but only 29% of patients were below 13 mm. The sign was unreliable when intra-abdominal pressure exceeded 12 mmHg. A small IVC helps when present, but most patients are in the uninformative middle.
Measure perpendicular to the long axis, close to the right atrial junction but not at the hepatic vein confluence. Subcostal acquisition → · Respiratory IVC indices →
Osman et al., 2007 · Leung & Levine, 1994 · Vignon et al., 2017
03 · Ventricular output
Same EF. Different stroke volume.
EF = (EDV − ESV) / EDV × 100%
Total LV stroke volume = EDV × EF / 100
At EF 70%, an EDV of 40 mL gives a total stroke volume of only 28 mL. A larger chamber can eject more blood despite a lower EF.
With mitral regurgitation, part of LV ejection returns to the left atrium. A preserved total EF can therefore coexist with reduced forward stroke volume. The model holds EF and EDV constant while you vary the proportion returning through the mitral valve.
Isolated MR model: forward SV = total SV × (1 − regurgitant fraction). It assumes no other regurgitation or shunt. It does not model the loading changes caused by real MR or determine MR severity.
Schematic · volume and ejection
Try EDV 40 mL and EF 70%, then restore EDV 120 mL and add MR. Describe total and forward ejection separately.
04 · Acquisition
Match the area to the velocity.
- Diameter: zoom the LVOT in an on-axis PLAX view. Measure inner edge to inner edge in midsystole, following the laboratory protocol; the 2019 ASE method places this approximately 3–10 mm proximal to the valve plane.
- Doppler: use A5C or A3C and align as parallel to LVOT flow as possible. Place the PW sample in the outflow tract, initially about 5 mm proximal to the aortic valve.
- Optimise: obtain a clear systolic spectrum. Broadening or valve contamination suggests the gate needs repositioning away from the acceleration region.
- Trace: follow the dense modal signal, excluding faint spectral noise. Average representative beats and document the rhythm.
The diameter and Doppler sample must represent the same anatomical level. A precise trace cannot rescue an oblique diameter.
Use colour to find the flow direction, then refine the view. Routine electronic angle correction is not recommended for cardiac Doppler; improve alignment by moving the probe.
Keep the view, gate, gain and tracing method consistent for serial comparisons. Avoid changing vasoactive support or ventilation during a diagnostic manoeuvre unless clinical safety requires it.
ASE comprehensive TTE, 2019 · Practise the gate in cardiac Sim 8 →
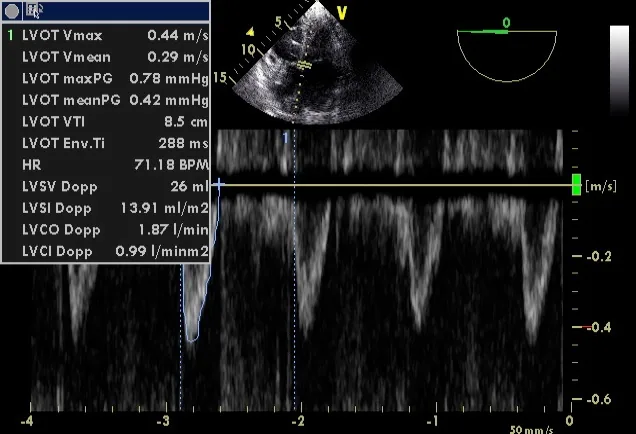
The real view: SV = CSA × VTI
05 · From distance to flow
VTI is a distance. Area makes it a volume.
Area = π × (diameter / 2)²
SV = area × VTI
CO = SV × heart rate / 1000
Diameter and VTI in centimetres give stroke volume in millilitres. Multiplying by beats per minute and dividing by 1000 gives litres per minute.
For diameter 2.0 cm, VTI 20 cm and HR 80/min: area 3.14 cm², stroke volume 62.8 mL and cardiac output 5.03 L/min. Adequacy still depends on body size, metabolic demand and perfusion.
Significant aortic regurgitation can make systolic LVOT flow exceed net systemic flow. Shunts, obstruction and irregular rhythm also need a more complete assessment.
Inputs represent an ideal reference signal. Angle and diameter-error controls introduce isolated measurement errors; real acquisition errors may coexist.
Schematic · LVOT area and Doppler envelope
Set diameter error to +10%. Then change only the Doppler angle. Explain why the errors can partly cancel without making the measurement reliable.
06 · Precision
Small errors can change the conclusion.
| Change | Effect in the ideal model | Practical response |
|---|---|---|
| Diameter overestimated by 10% | Area and calculated SV increase by 21%. | Review the view and calipers before trusting absolute output. |
| Diameter underestimated by 10% | Area and calculated SV decrease by 19%. | The squared relationship is not symmetrical. |
| Doppler angle increases | Measured velocity falls approximately with cos θ. | Improve alignment; do not average poor and good windows. |
| HR changes during a test | VTI change and CO change diverge. | Record HR and interpret the complete flow response. |
For a short intervention with stable LVOT area, relative VTI change estimates relative stroke-volume change. Re-measuring diameter at every stage adds noise. A baseline of 16 cm and test value of 18 cm gives a 12.5% rise; the same two values with an unstable gate do not establish a physiological response.
Repeat baseline traces when a result is close to the decision threshold. Reproducibility, not the calculator’s decimal places, determines confidence.
07 · Reversible preload challenge
Perform the manoeuvre before interpreting its number.
- Start semi-recumbent with a stable flow baseline.
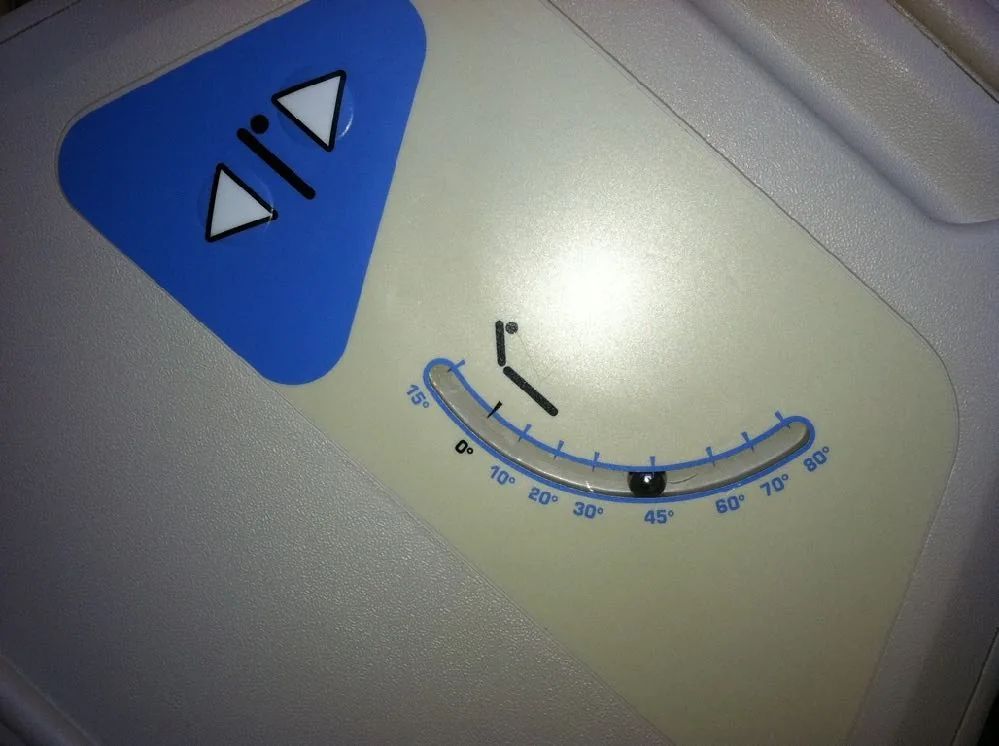
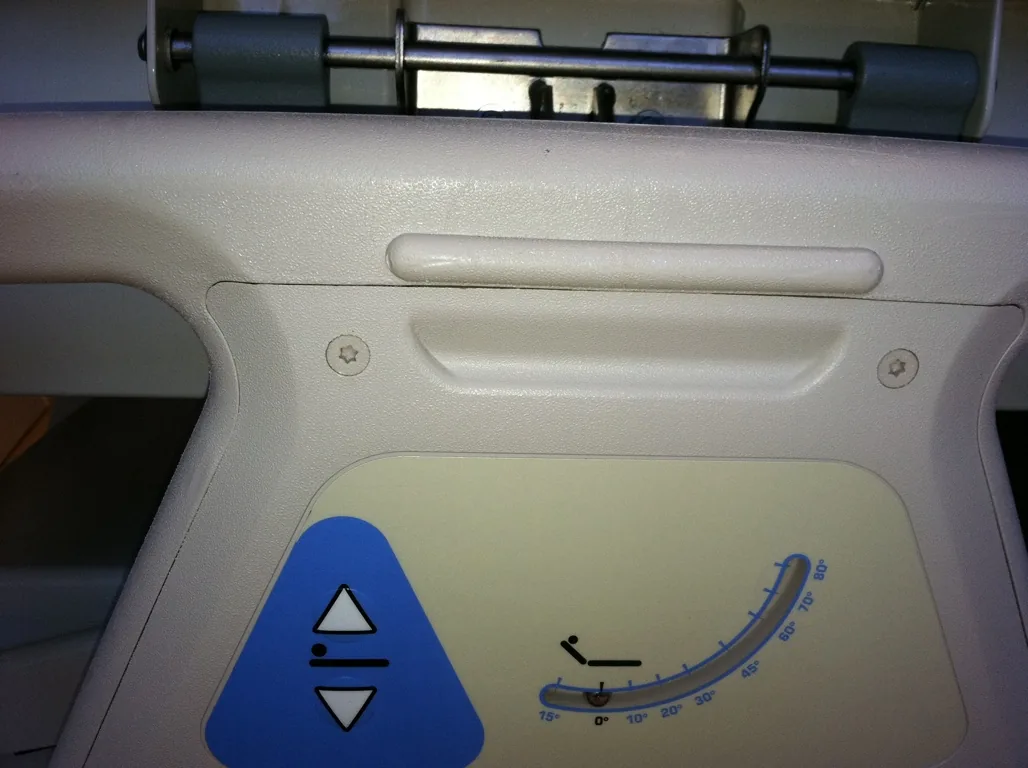
- Use the bed to lower the trunk while raising the legs to about 45°. This recruits blood from both the legs and splanchnic compartment.
- Measure the early maximal SV or CO response, usually within the first minute. The effect can fade quickly.
- Return to the original position and confirm that flow returns towards baseline.
A blood-pressure change alone is an inadequate substitute for the flow response. VTI tracks SV if the LVOT area and acquisition remain stable.
PLR can be useful during spontaneous breathing or arrhythmia, when respiratory variation indices are unreliable. The flow measurement must still be sufficiently precise.
Avoid pain, coughing, active leg lifting and sympathetic stimulation. A new tachycardia is a clue to a confounded test. Increased intra-abdominal pressure can cause a false negative; clinical constraints may make positioning unsuitable.
Do not delay urgent resuscitation to complete a test in a deteriorating patient.
Use the bed, not the staff
More pitfalls
- False change from the probe: moving the patient can change the Doppler angle, which changes VTI by itself. Keep the probe and window steady.
- False negative: a severely hypovolaemic patient may not rise, because there is little blood left in the legs to move. Intra-abdominal pressure >16 mmHg can also cause a false negative.
- Avoid or adapt with abdominal compartment syndrome, an open abdomen, or an unstable pelvic or low lumbar fracture.
- Time and logistics: allow flow to settle back to baseline before a repeat test (about 90 s to 3 min between measurements), but read the PLR value at its early peak.
08 · Response over time
The peak can disappear before a late measurement.
Run each scripted scenario. Compare baseline, the early PLR peak, and recovery after the bed returns to its starting position.
- Responsive: a transient flow rise with little HR change.
- No meaningful rise: preload increases without a clear SV response.
- Tachycardia: a rising CO may reflect sympathetic stimulation rather than the preload effect being tested.
Change (%) = (during − baseline) / baseline × 100
The denominator is baseline, not the mean of the two values. A result is interpretable only if the test was performed correctly and the signal remained stable.
Schematic · scripted physiological responses
Time courses are illustrative, not fitted patient data. Scrub the timeline to compare identical phases between scenarios.
09 · Interpreting a change
A borderline number needs better measurement.
Around 10% is a commonly studied PLR-induced CO threshold. One TTE study in spontaneously breathing patients used a ≥12.5% SV rise to predict a ≥15% response to fluid. These are method- and protocol-specific results, not interchangeable universal cut-offs.
A study of repeated TTE examinations found a median least significant VTI change of 11% between examinations by the same operator. Precision was better when the probe remained in place. Averaging three beats in sinus rhythm and five in AF gave adequate within-examination precision in that study; more sampling may be needed with marked variability.
If VTI rises by 9–12%, ask: was alignment unchanged, was the peak captured, were representative beats averaged, did HR change, and did the value return to baseline?
Repeat an uncertain test or use an alternative valid method. Do not turn a small noisy change into a confident instruction to give or withhold fluid.
Check the denominator. Some teaching slides cite a 12% PLR rise in VTI (Lamia 2007; Maizel 2007) but divide the change by the mean of the two values, the formula used for respiratory variation. A PLR change is a rise from baseline: 16 → 18 cm is 12.5% from baseline but 11.8% using the mean. Near a threshold, the formula decides the answer.
10 · Caval variation
Name the formula before quoting the percentage.
Follow the IVC into the right atrium. Measure perpendicular to the vessel, and observe several breaths. Off-centre cuts and translation out of the image plane can imitate collapse.
Collapsibility = ΔD / Dmax × 100
Distensibility = ΔD / Dmin × 100
Variability = ΔD / Dmean × 100
Here Dmean is (Dmax + Dmin)/2. With 20 and 10 mm, the three indices are 50%, 100% and 66.7%. They describe the same diameters using different denominators.
Historical controlled-ventilation studies used thresholds such as 18% distensibility (Barbier, denominator minimum) and 12% variability (Feissel, denominator mean). Both required intubated patients with no respiratory effort and tidal volume >8 mL/kg predicted body weight. Their settings and patient selection matter; neither is a universal prescription. In Feissel’s series, 22 of 23 non-responders had an IVC >1.5 cm.
IVC and RA pressure table, and Sim 7 →
Schematic · calibre, breathing and indices
Spontaneous inspiration usually narrows the IVC; passive positive-pressure inspiration may distend it. The model isolates this usual pattern and does not diagnose volume status.
Gillman et al., 2009, supplement 8. Source · CC BY 2.0. Transcoded; audio and metadata removed; display aspect ratio preserved. Media record →
11 · Caval pitfalls
Describe the IVC before you interpret it.
Technique traps
- Movement in and out of the plane exaggerates collapse: the vessel slides out of the beam and seems to shrink.
- Do not measure at the hepatic vein confluence, and do not mistake the aorta for the IVC (thick wall, pulsatile, does not join the right atrium).
| IVC looks | Despite the volume state, because of |
|---|---|
| Large, little variation | RV failure, tamponade, pulmonary embolism, tricuspid regurgitation, pulmonary hypertension or constriction; positive-pressure ventilation and PEEP. |
| Small or collapsing | Raised intra-abdominal pressure; forceful inspiratory effort, as in status asthmaticus. |
Why a small, collapsing IVC is the more useful finding. The causes of a falsely large IVC are much commoner than the causes of a falsely small one. So a large IVC tells you little about fluid response; a small, collapsing IVC is more likely to mean what it seems.
Three patients in shock
These three subcostal clips come without a diagnosis or answer. Practise the description, which is the part you can defend:
- Is it the IVC? Follow it into the right atrium.
- Size at end-expiration, against the depth scale.
- Change with breathing: none, partial or complete collapse? Is the patient breathing spontaneously or ventilated?
- Is the change real, or translation out of the plane?
- What else would you scan before deciding: RV, pericardium, LV, lungs?
What these clips do and do not tell us
No diameters, breathing mode or diagnoses are given, so none are assigned here. The point is the sequence: describe the vessel, name the breathing mode, then decide whether the finding is informative. A large IVC in a shocked patient sends you to the RV and pericardium; it does not tell you to withhold fluid on its own.
12 · Heart–lung interaction
The ventilator changes preload and afterload.
Positive intrathoracic pressure can reduce venous return. Lung inflation and pulmonary vascular effects can also increase RV afterload; the response depends on lung volume, compliance and existing RV disease.
A large IVC on PEEP does not prove excess circulating volume. A small IVC with vigorous inspiratory effort does not prove that fluid is safe. Interpret the vessel alongside RV function, ventilation and perfusion.
Record whether breathing is spontaneous, assisted or fully controlled; include tidal volume, PEEP, rhythm and any relevant abdominal pressure.
Four mechanisms in a positive-pressure breath
- RV preload falls: rising pleural pressure reduces venous return. Usually the dominant effect.
- RV afterload rises: alveolar pressure rises more than pleural pressure.
- LV preload rises briefly: blood is squeezed out of the pulmonary capillaries.
- LV afterload falls.
The fall in RV output reaches the LV a few beats later, after pulmonary transit. The more LV stroke volume swings with the ventilator, the more likely the heart is preload responsive.
When respiratory indices mislead
- Spontaneous effort or patient–ventilator interaction.
- Low tidal volume or low respiratory-system compliance.
- Arrhythmia, especially for arterial pulse-pressure variation.
- RV dysfunction or altered pulmonary vascular load.
- Raised intra-abdominal pressure.
End-expiratory occlusion, tidal-volume challenges and mini-fluid challenges require defined protocols and precise flow monitoring. Do not increase tidal volume simply to obtain a more convenient number.
Conditions for these indices: passive (sedated, no effort) on the ventilator, tidal volume 8–10 mL/kg, sinus rhythm. In ARDS, low lung compliance as well as low tidal volume limits how much airway pressure reaches the heart, which is a main reason pulse pressure and stroke volume variation fail there.
Pulse pressure variation is not enough. A low LV preload can come from hypovolaemia or from a failing RV; PPV cannot tell them apart. Echo can, so the two are complementary.
Mini-fluid challenge: three studies
All used 100 mL in ventilated patients: Muller 2011 (colloid over 1 minute; the change in aortic VTI predicted response in 39 patients with acute circulatory failure, AUC 0.92), Mallat 2015 (colloid; the fall in pulse pressure and stroke volume variation, 49 patients ventilated at <8 mL/kg) and Biais 2017 (crystalloid; 44 patients ventilated at 6–8 mL/kg during neurosurgery). A 100 mL bolus changes VTI by only a few per cent, so the method depends on a very precise, unchanged Doppler signal.
13 · Aortic velocity
Peak velocity stands in for stroke volume, beat by beat.
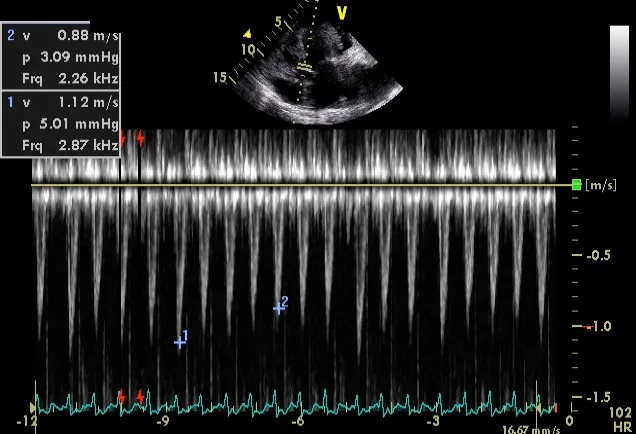
Aortic blood flow is proportional to LV stroke volume, so the respiratory swing in LVOT peak velocity tracks the swing in stroke volume. Reading peaks is quicker than tracing a VTI for every beat. Feissel et al. (2001) showed this with TOE in ventilated patients with septic shock.
ΔVpeak = 100 × (Vpeak max − Vpeak min) / Vpeak mean
Vpeak mean = (max + min) / 2
A ΔVpeak >12% identified responders in that study. The denominator is the mean of the two values, unlike a PLR change.
- Apical five-chamber, PW gate in the LVOT just below the valve, as for VTI.
- Slow the sweep so that several breaths fit on the screen.
- Measure the highest and lowest peak velocity within one respiratory cycle.
Pitfalls: severe aortic stenosis, irregular rhythm, RV failure, low tidal volume, high PEEP and ARDS. Spontaneous breaths also invalidate it.
Calculator · ΔVpeak
Arithmetic only. It does not check rhythm, ventilation or tidal volume, and it is not a treatment instruction.
14 · Evidence
Every dynamic index is only moderately accurate.
Vignon et al. (2017) compared four indices in 540 ventilated patients with acute circulatory failure of any cause, in the first 24 hours. Each was measured in the same patients against a fluid challenge.
| Index | Best threshold | Sensitivity | Specificity | AUC | Threshold for ~90% specificity |
|---|---|---|---|---|---|
| Pulse pressure variation (ΔPP) | ≥11% | 58% | 72% | 0.675 | 18% |
| Aortic peak velocity variation (ΔVmaxAo) | ≥10% | 79% | 64% | 0.752 | 18% |
| SVC variation (ΔSVC, TOE) | ≥21% | 61% | 84% | 0.755 | 31% |
| IVC variation (ΔIVC, TTE) | ≥8% | 55% | 70% | 0.635 | 18% |
Values are for the whole study population. In the subset with all four indices, ΔSVC performed best.
Feasibility
ΔPP and ΔVmaxAo could be obtained in about 78% of patients, but in more than 90% of those in sinus rhythm. ΔIVC was obtained in 78%. ΔSVC was measurable in almost everyone, but it needs TOE.
What to do with a grey zone
The authors suggest a pragmatic reading. With persistent hypoperfusion and a low risk of lung water, fluid may still be reasonable even when variation is low (<10%). When the risk of overload is high, as in ARDS, insist on the specific threshold (18% for ΔVmaxAo and ΔIVC) before giving fluid. In other words, the answer to “tolerance” sets how certain “response” must be.
A cluster, not a rule
Geri et al. (2019) clustered septic shock patients. In the cluster with LVOT VTI <16 cm (low stroke volume), mitral E <67 cm/s (low filling pressure) and SVC collapsibility >39% (low RV preload), the combination was 99.3% specific for fluid responsiveness. It was a post hoc cluster analysis: each value alone is far less informative, E can be below 67 cm/s in healthy people, and a foreshortened view or non-parallel beam underestimates VTI.
Take-home thresholds
| Breathing | Index | Threshold |
|---|---|---|
| Spontaneous | PLR rise in VTI (from baseline) | ≥12% |
| IVC collapsibility | ~40%: probably responsive | |
| Ventilated, passive | Aortic VTI or Vpeak variation | >12% (mean denominator) |
| IVC distensibility | >12% (mean) or >18% (minimum) |
Always consider the respiratory status and RV function, and reassess often.
15 · The cost of volume
Look downstream as well as forward.
| Domain | Useful observations | Interpretation |
|---|---|---|
| Lung | B-line distribution, new confluent artefacts, consolidation and effusions. | Reduced aeration has several causes. Serial change may warn that fluid is worsening pulmonary oedema. |
| Right heart | RV size, function, septal interaction, tricuspid regurgitation. | A distended failing RV may worsen with further volume. RV assessment → |
| Left heart filling | Mitral inflow E velocity; LV size and wall thickness. | A low E fits low filling pressure, but E alone is not a filling-pressure measurement: age, relaxation and loading all change it. |
| Systemic veins | IVC plus hepatic, portal and intrarenal Doppler. | Venous abnormalities support congestion; identify its cause. |
| Clinical trajectory | Oxygenation, work of breathing, organ function, fluid balance and perfusion. | Integrate with ultrasound rather than replacing clinical assessment. |
A-lines do not grant permission to infuse. B-lines do not prove cardiogenic oedema. New adverse pulmonary or venous findings during resuscitation should trigger reassessment before further fluid.
If fluid is appropriate, define its purpose, amount, delivery interval and reassessment endpoint beforehand. Reassess SV or CO and tissue perfusion alongside signs of harm.
Early sepsis: a small, hyperdynamic LV can develop dynamic intraventricular obstruction, associated with hypovolaemia (Chauvet 2015). Pump patterns in shock → For a structured perioperative sequence (chronic disease, pump, volume versus vasodilatation, tamponade, lungs), see Shock assessment.
16 · Venous Doppler
A congestion score is not a treatment order.
VExUS combines IVC size with hepatic, portal and intrarenal venous waveforms. In the original scheme, IVC <2 cm gives grade 0. With IVC ≥2 cm: no severe waveform gives grade 1; one gives grade 2; two or more give grade 3.
Severe patterns are hepatic systolic flow reversal, portal pulsatility ≥50%, and discontinuous monophasic intrarenal venous flow. Time waveforms against the cardiac cycle and confirm that the signal is venous.
Portal pulsatility = (Vmax − Vmin) / Vmax × 100%
What the score cannot establish
- Grade 0 means no congestion by this scheme; it does not guarantee fluid tolerance.
- High grades do not distinguish fluid overload from RV failure, severe TR or obstructive physiology.
- Severe TR alters hepatic Doppler; portal pulsatility can occur in healthy people. Renal signals can be technically difficult.
- The original study linked severe congestion to AKI after cardiac surgery. An association does not prove that treating to a score improves outcomes.
Use the finding to reassess further fluid and seek the mechanism. Decongestion is a considered treatment for congestion, not an automatic response to an isolated score.
17 · Case
The PLR is positive. The lungs are deteriorating.
A patient with septic shock has persistent poor capillary refill despite initial resuscitation. A technically stable PLR raises VTI from 16 to 19 cm, with unchanged HR and recovery to baseline. Oxygen requirement has risen, with new bilateral confluent B-lines and an impaired RV.
Does this establish that the next treatment should be fluid?
Reveal reasoning
The rise is 18.75%, supporting preload responsiveness under these test conditions. It does not establish tolerance or prove that more fluid is the best way to improve perfusion.
Reassess the pulmonary process, RV function, systemic congestion and vasoactive support. The new findings weigh against an automatic bolus. Treat the mechanism and monitor both perfusion and harm; a responsive patient can still have a poor risk–benefit balance for further volume.
Constructed teaching vignette. The combination of findings is deliberate; it is not a validated decision rule.
18 · Case
A convincing percentage from an unstable trace.
VTI changes from 16 to 18 cm during PLR. The operator moves the probe to regain the window, the patient coughs, and HR rises from 80 to 105/min. No recovery measurement is obtained.
What should be repeated before calling this responsive?
Reveal reasoning
The arithmetic is correct: +12.5%. The inference is not secure. Changed alignment or sample position, coughing and tachycardia confound the result.
Re-establish a stable baseline, explain the manoeuvre, retain the same window where possible, sample representative beats, capture the early peak and confirm recovery. If a reliable echo signal cannot be maintained, choose another validated flow method suited to the clinical circumstances.
VTI is a stroke-volume surrogate. With a changing HR it is not interchangeable with cardiac-output change.
19 · Case
The IVC is large. What has caused it?
Following a PEEP increase, a ventilated patient becomes hypotensive. The IVC measures 24 mm with little variation. The RV is larger than on the previous scan, and the septum is flattened in systole.
Would the IVC alone justify diuresis or another fluid bolus?
Reveal reasoning
Neither. The findings raise concern for adverse heart–lung interaction and RV loading. Reassess ventilation, oxygenation, perfusion, RV function and alternative causes, including pneumothorax or pulmonary vascular obstruction when clinically plausible.
Do not apply the spontaneous-breathing IVC-to-RAP table as though PEEP had no effect. A pressure-related venous change is not a direct measurement of total circulating volume.
Review the intervention with the treating team and repeat the haemodynamic assessment. Treat the cause rather than a diameter.
20 · Clip questions
Two clip questions. Commit, then read why.
21 · Retrieval
Choose the interpretation.
22 · References
Read the method behind the number.
- Mitchell C et al. Comprehensive transthoracic echocardiographic examination. ASE, 2019. Guideline →
- Lang RM et al. Cardiac chamber quantification. ASE/EACVI, 2015. Guideline →
- Zoghbi WA et al. Native valvular regurgitation. ASE, 2017. Guideline →
- Monnet X et al. Circulatory shock and haemodynamic monitoring. ESICM, 2025. Guideline →
- Monnet X, Teboul JL. Passive leg raising: five rules, not a drop of fluid! Critical Care, 2015;19:18. Open article →
- Lamia B et al. Echocardiographic prediction of volume responsiveness in critically ill patients with spontaneously breathing activity. Intensive Care Medicine, 2007;33:1125–1132. Study →
- Jozwiak M et al. What is the lowest change in cardiac output that transthoracic echocardiography can detect? Critical Care, 2019;23:116. Open study →
- Barbier C et al., 2004, and Feissel M et al., 2004. Respiratory IVC variation in ventilated septic patients. Barbier → · Feissel →
- Osman D et al. Cardiac filling pressures are not appropriate to predict hemodynamic response to volume challenge. Critical Care Medicine, 2007;35:64–68. PubMed search →
- Leung JM, Levine EH. Left ventricular end-systolic cavity obliteration as an estimate of intraoperative hypovolemia. Anesthesiology, 1994;81:1102–1109. PubMed search →
- Michard F, Teboul JL. Using heart–lung interactions to assess fluid responsiveness during mechanical ventilation. Critical Care, 2000;4:282–289. PubMed search →
- Feissel M et al. Respiratory changes in aortic blood velocity as an indicator of fluid responsiveness in ventilated patients with septic shock. Chest, 2001;119:867–873. PubMed search →
- Vignon P et al. Comparison of echocardiographic indices used to predict fluid responsiveness in ventilated patients. American Journal of Respiratory and Critical Care Medicine, 2017. PubMed search →
- Geri G et al. Cardiovascular clusters in septic shock combining clinical and echocardiographic parameters: a post hoc analysis. Intensive Care Medicine, 2019;45:657–667. PubMed search →
- Society of Critical Care Medicine. Critical Care Ultrasound: Adult, Day 1, “Echocardiographic Evaluation of Hypovolemia and Volume Responsiveness”. Used with permission. Media record →
- Beaubien-Souligny W et al. Development of the venous excess ultrasound grading system. Ultrasound Journal, 2020;12:16. Open study →
Next: Integrate the findings in shock → · Assess pulmonary patterns → · All POCUS lectures →
Adult teaching material. The simulations are schematic and the cases are constructed; the clips and stills are real scans. Some values were quoted from the SCCM course slides and were not independently re-checked. Use supervised acquisition and local clinical protocols.